Fig. 8.
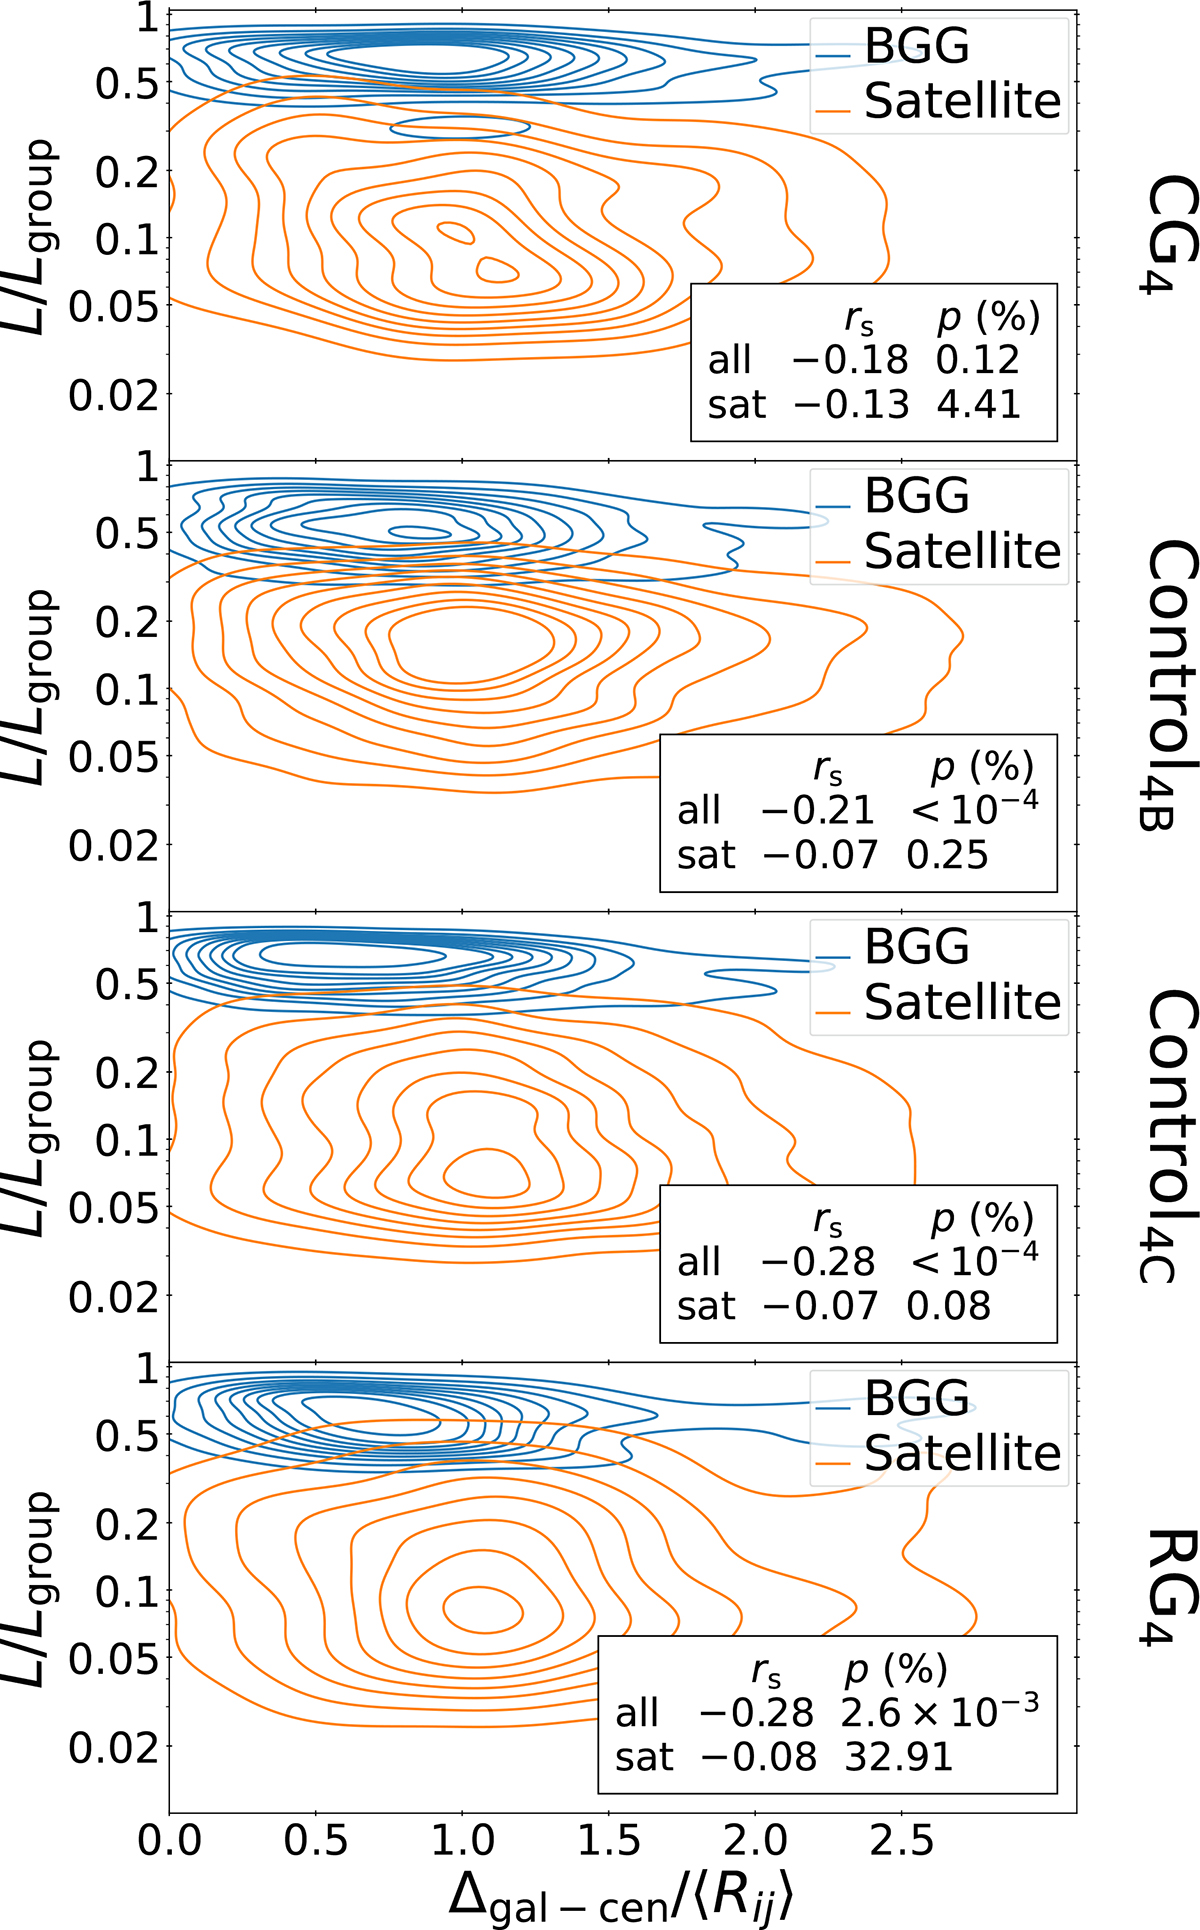
Download original image
Luminosity segregation in the four group samples: galaxy luminosity fraction versus relative position of galaxy relative to the group centroid. The panels show the kernel density estimator contour level lines for CG4, Control4B, Control4C, and RG4 from top to bottom, respectively. The BGGs are shown in blue and the satellites in orange. The rank correlations and corresponding p values (in percent) are displayed for all galaxies of the group (i.e., including BGGs) and for the satellite galaxies (i.e., non-BGGs) only.
Current usage metrics show cumulative count of Article Views (full-text article views including HTML views, PDF and ePub downloads, according to the available data) and Abstracts Views on Vision4Press platform.
Data correspond to usage on the plateform after 2015. The current usage metrics is available 48-96 hours after online publication and is updated daily on week days.
Initial download of the metrics may take a while.