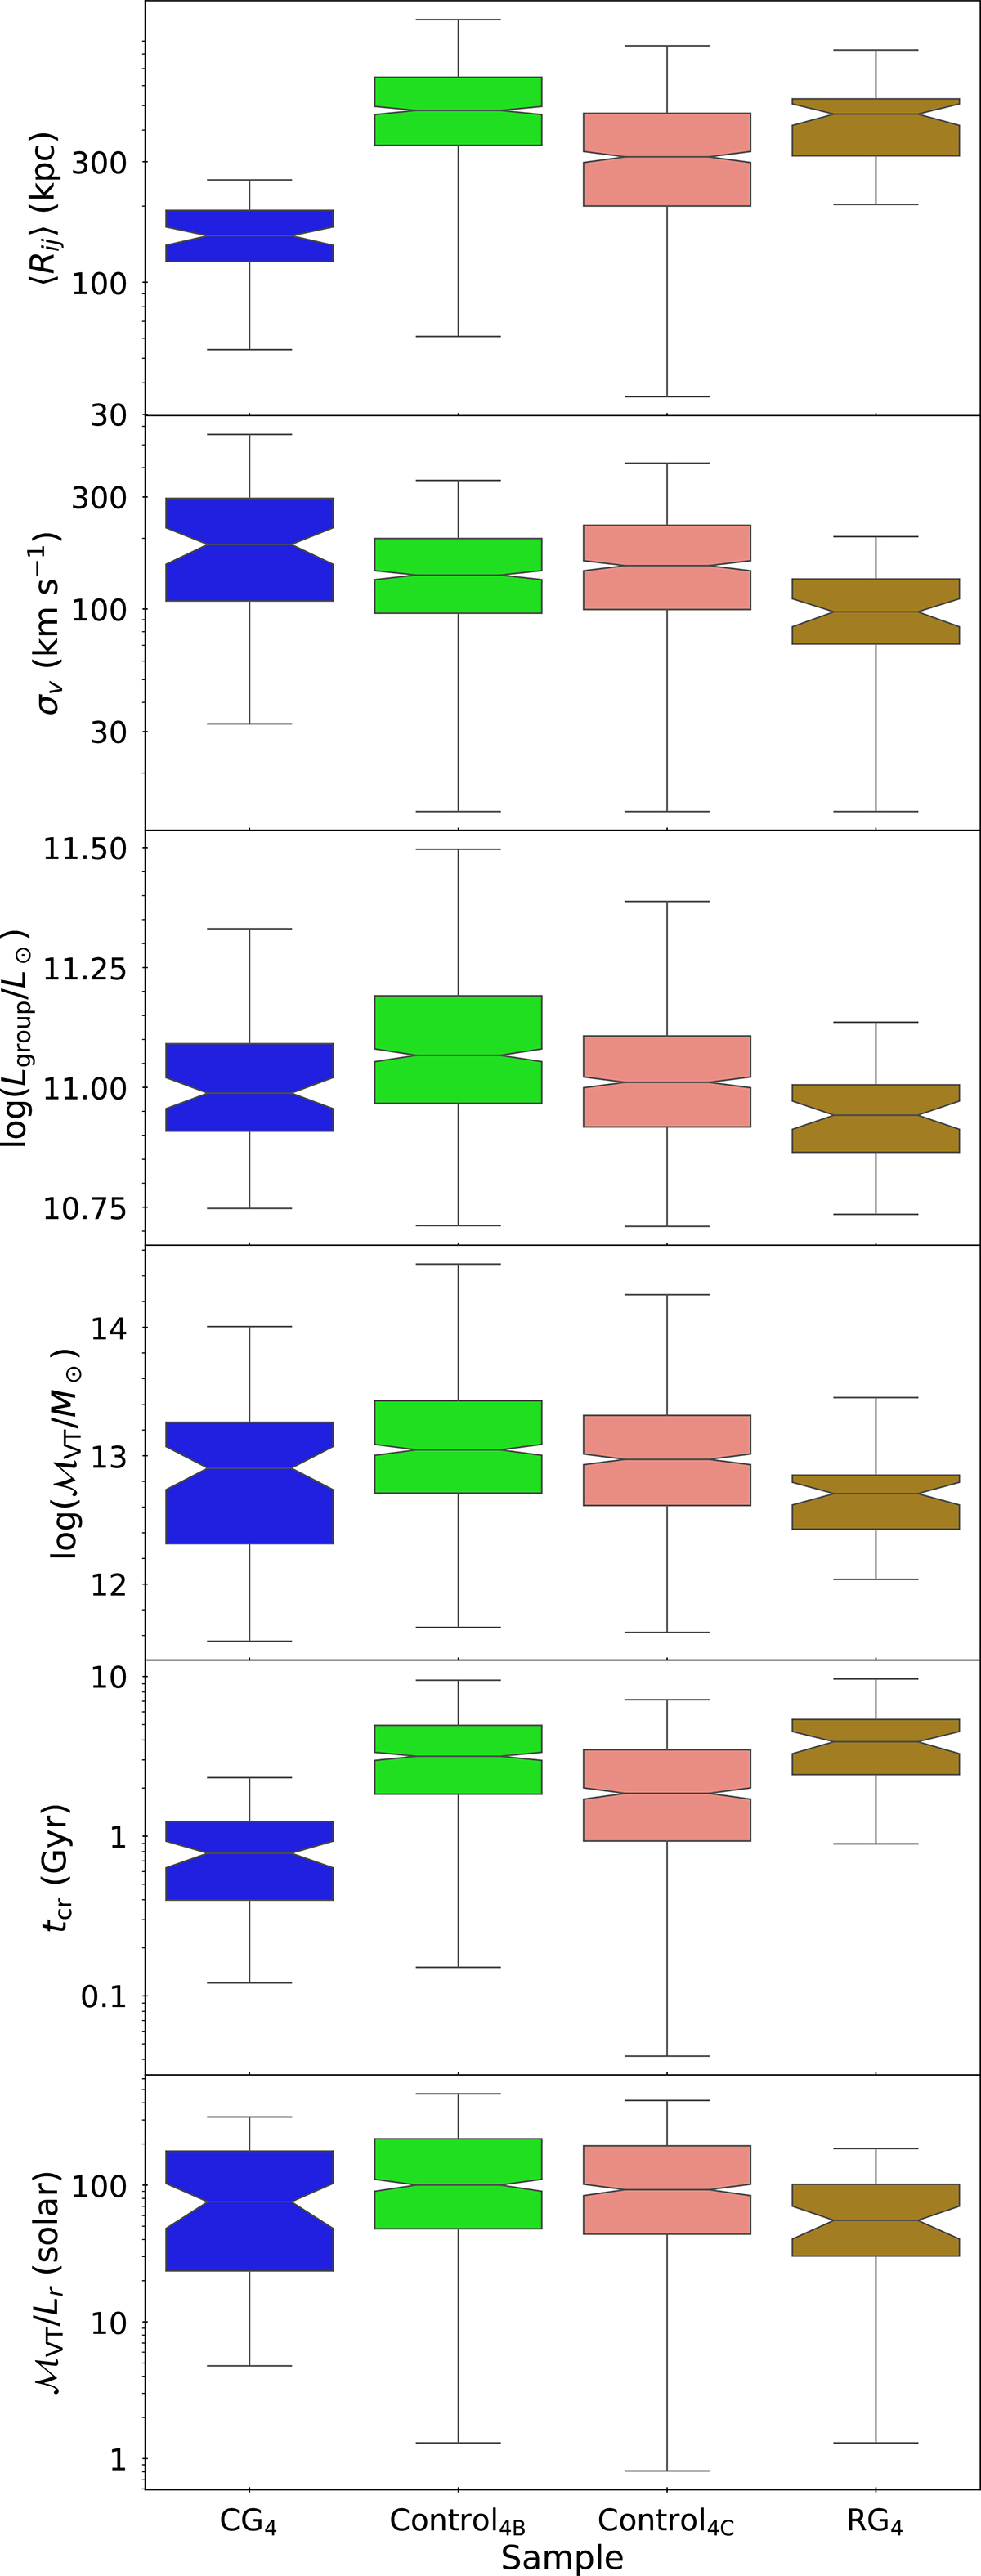
Fig. 6.
Download original image
Distributions of group properties for the different samples. From top to bottom, median of the projected inter-galaxy separations, radial velocity dispersion, group r-band luminosity, virial theorem mass, crossing time, and virial theorem mass to light ratio. The probabilities that the median quantities for the Control4B, Control4C, and RG4 samples are consistent with those of the CG4 sample are listed in Table 2.
Current usage metrics show cumulative count of Article Views (full-text article views including HTML views, PDF and ePub downloads, according to the available data) and Abstracts Views on Vision4Press platform.
Data correspond to usage on the plateform after 2015. The current usage metrics is available 48-96 hours after online publication and is updated daily on week days.
Initial download of the metrics may take a while.