Fig. 6.
Download original image
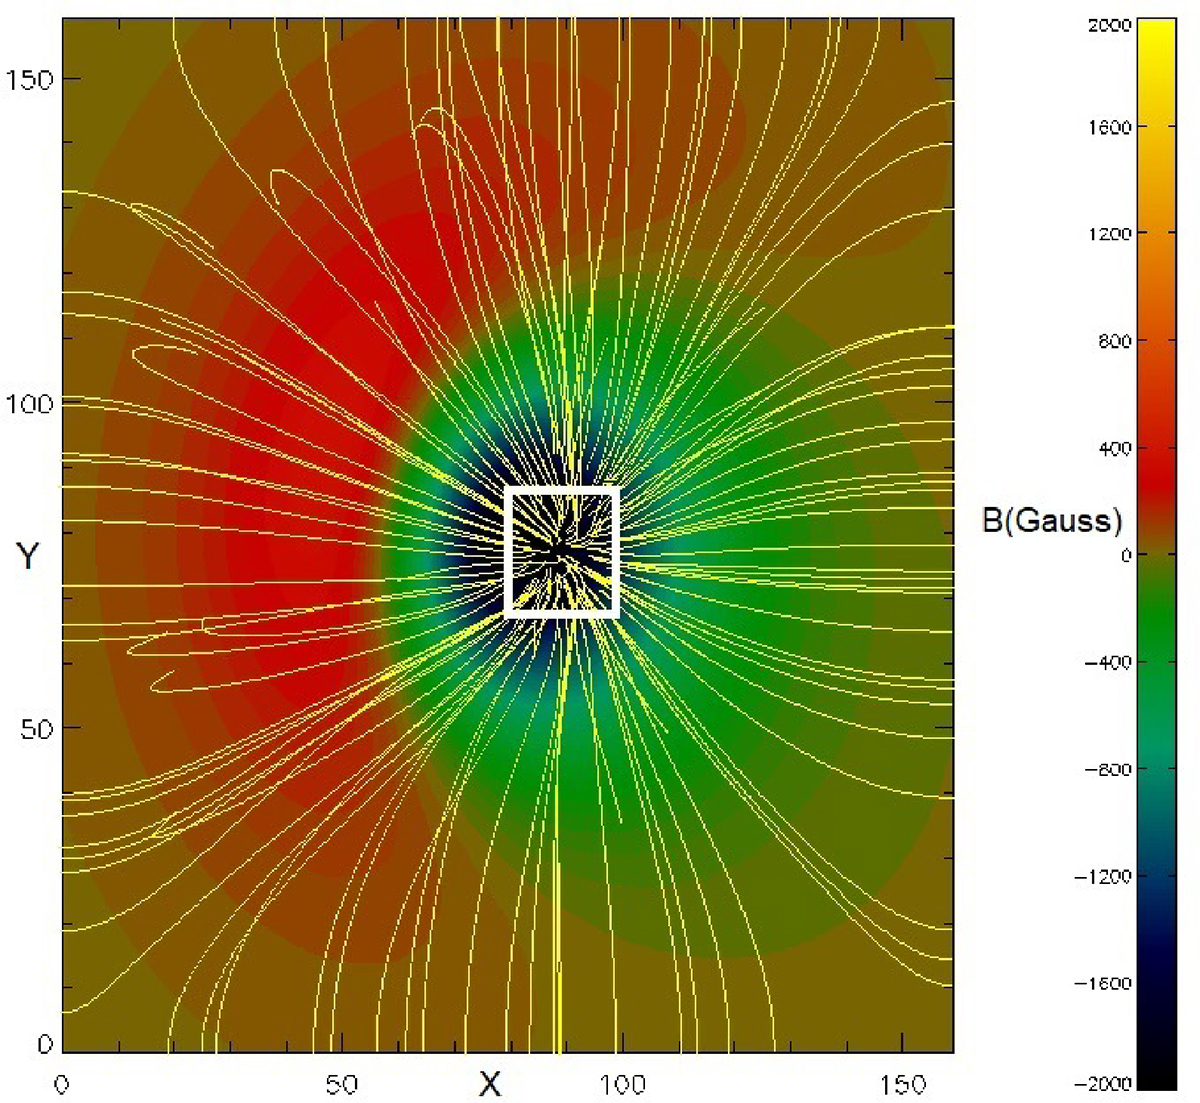
Artificial line of sight magnetogram of dimensions 160×160 used as the lower base for the computational box for reconstructing the magnetic field. The white square of dimensions 20×20 gridpoints indicates a portion of the active region where fluctuations were analysed. The colour bar represents the magnetic field intensity in Gauss.
Current usage metrics show cumulative count of Article Views (full-text article views including HTML views, PDF and ePub downloads, according to the available data) and Abstracts Views on Vision4Press platform.
Data correspond to usage on the plateform after 2015. The current usage metrics is available 48-96 hours after online publication and is updated daily on week days.
Initial download of the metrics may take a while.