Fig. 8
Download original image
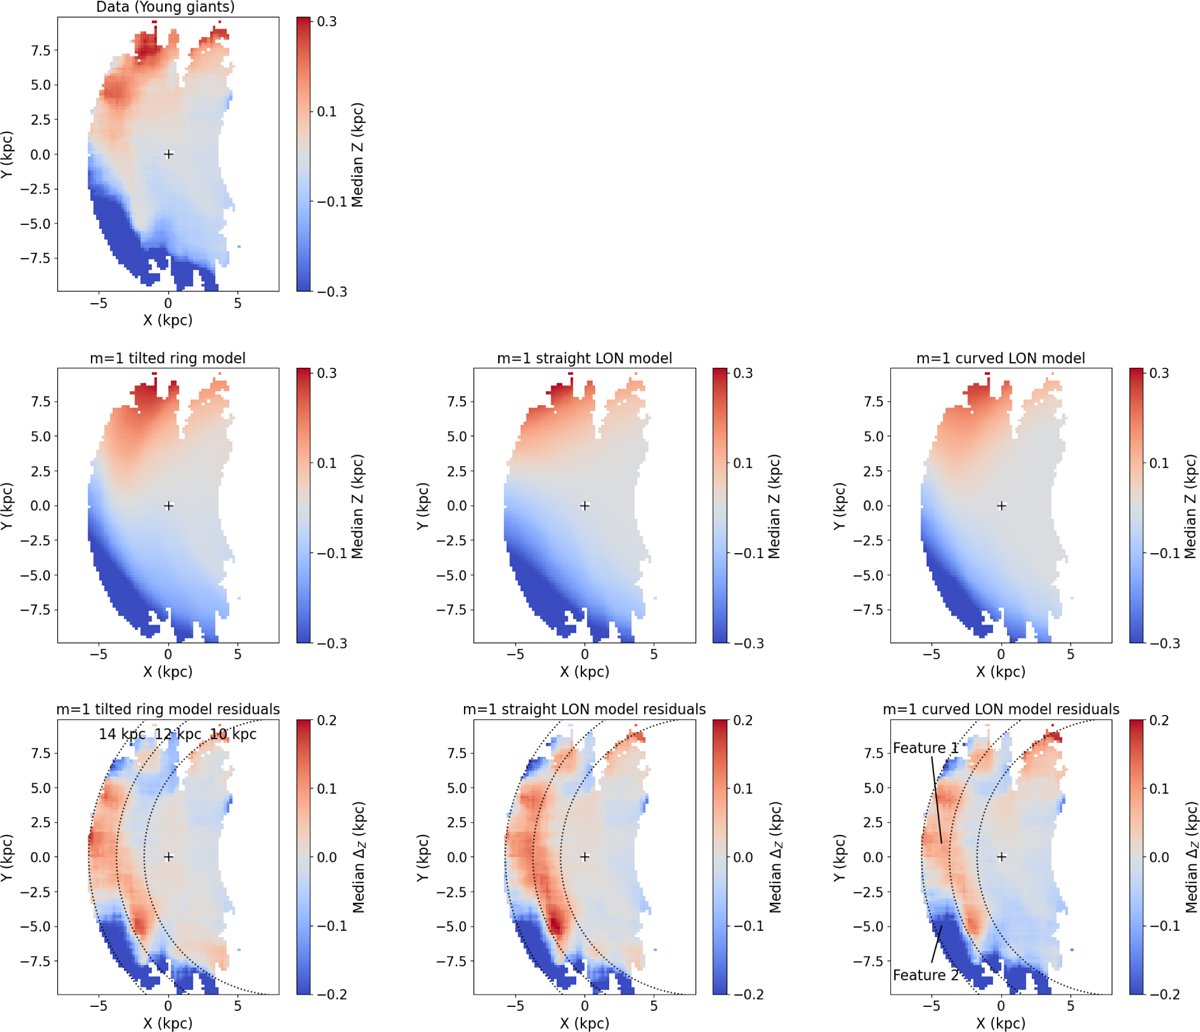
Comparison between the maps of median Z-coordinate from observations, best-fit model and residuals. Top-left: median Z-coordinate of the young giant sample. The position of the Sun is shown by the black cross at (X,Y)=(0 kpc, 0 kpc). Middle: prediction from the m=1 tilted rings model (left), straight line-of-nodes parametric model (centre) and twisted line-of-nodes parametric model (right). Bottom: corresponding vertical residuals for the m=1 tilted rings model (left), straight line-of-nodes parametric model (centre), and twisted line-of-nodes parametric model (right). Dotted lines in the three lower panels show rings at constant radii of R=10, 12, and 14 kpc from the GC. An interactive 3D view of this figure is available online.
Current usage metrics show cumulative count of Article Views (full-text article views including HTML views, PDF and ePub downloads, according to the available data) and Abstracts Views on Vision4Press platform.
Data correspond to usage on the plateform after 2015. The current usage metrics is available 48-96 hours after online publication and is updated daily on week days.
Initial download of the metrics may take a while.