Fig. 17
Download original image
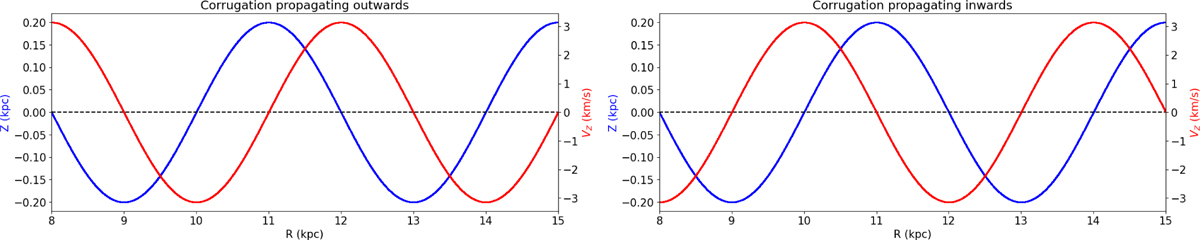
Predicted Z coordinate (blue) and VZ pattern (red) as a function of Galactictocentric radius R based on the simple toy model described in Appendix D (see Equation (D.2)). The curves show the case of a corrugation propagating towards the outer parts of the disc at vc=10 km/s (left panel) or the inner parts of the disc at vc = −10 km/s (right panel).
Current usage metrics show cumulative count of Article Views (full-text article views including HTML views, PDF and ePub downloads, according to the available data) and Abstracts Views on Vision4Press platform.
Data correspond to usage on the plateform after 2015. The current usage metrics is available 48-96 hours after online publication and is updated daily on week days.
Initial download of the metrics may take a while.