Fig. 8
Download original image
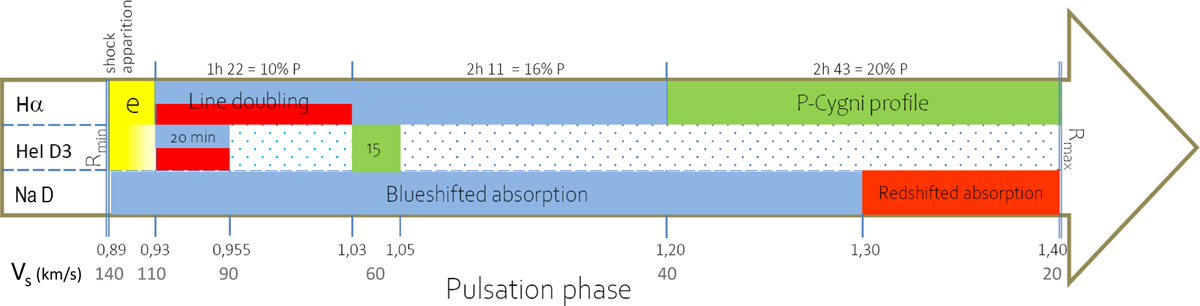
Line profile evolution of Hα, D3 He I and Na D vs. the pulsation phase from minimum Rmin to maximum Rmax of the photospheric radius. The apparition of the strongest Hα emission near 0.89 at Rmin corresponds to the emergence of the main shock from the subphotospheric layers. The letter e means that an emission is present within the Hα line profile (yellow). The blueshifted and redshifted absorption components are shown in blue and red. A P Cygni profile is shown in green. The shock velocity corresponds to an average velocity deduced from Fig. 8 of Gillet et al. (2019). For D3, the dotted area indicates that no emission or absorption line could be detected. The scale and phases are approximate.
Current usage metrics show cumulative count of Article Views (full-text article views including HTML views, PDF and ePub downloads, according to the available data) and Abstracts Views on Vision4Press platform.
Data correspond to usage on the plateform after 2015. The current usage metrics is available 48-96 hours after online publication and is updated daily on week days.
Initial download of the metrics may take a while.