Fig. 7
Download original image
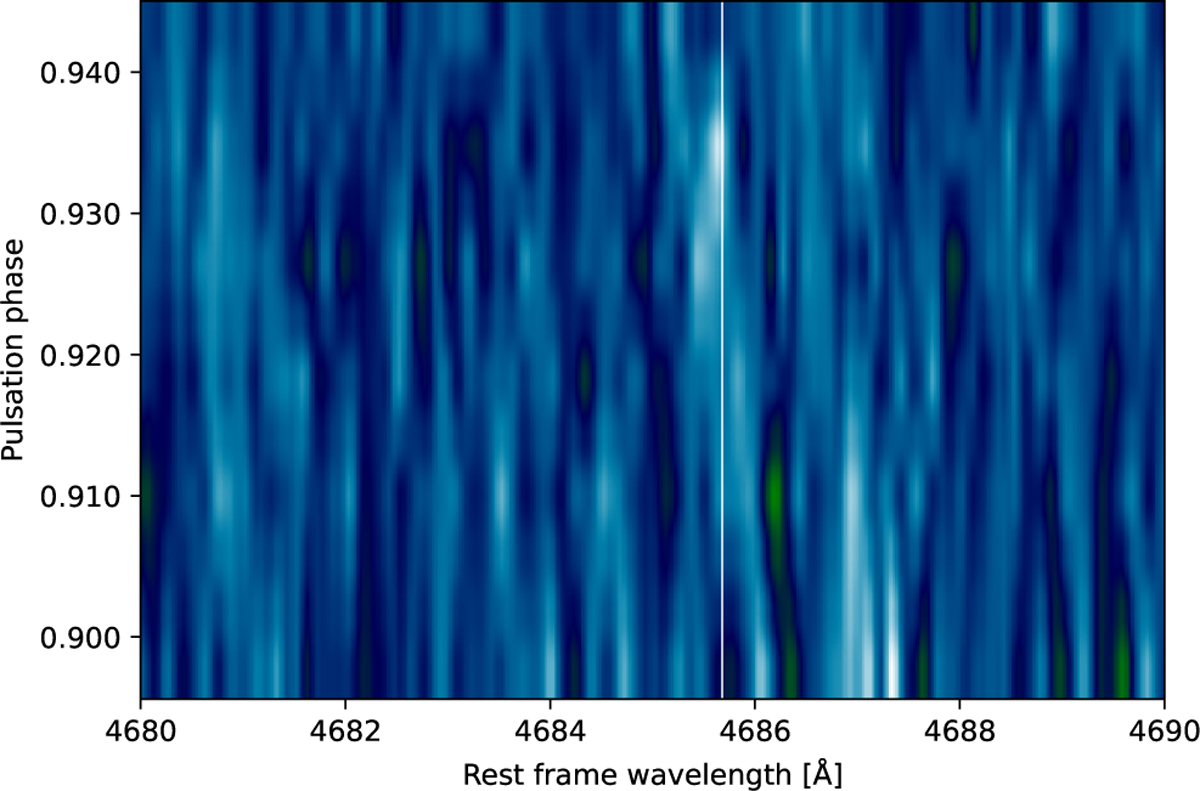
Trailed spectrum of He II line (4685.68 Å) build with eight spectra from the time series of September 5, 1995. The He II emission is visible from φ ∼ 0.927 to φ ∼ 0.937 (two consecutive spectra) as a short bright vertical spindle despite the weak signal. The He II emission follows the He I λ5875.66 first emission, which occurred between φ ∼ 0.906 − 0.925, as expected. The vertical white line indicates He II laboratory wavelength.
Current usage metrics show cumulative count of Article Views (full-text article views including HTML views, PDF and ePub downloads, according to the available data) and Abstracts Views on Vision4Press platform.
Data correspond to usage on the plateform after 2015. The current usage metrics is available 48-96 hours after online publication and is updated daily on week days.
Initial download of the metrics may take a while.