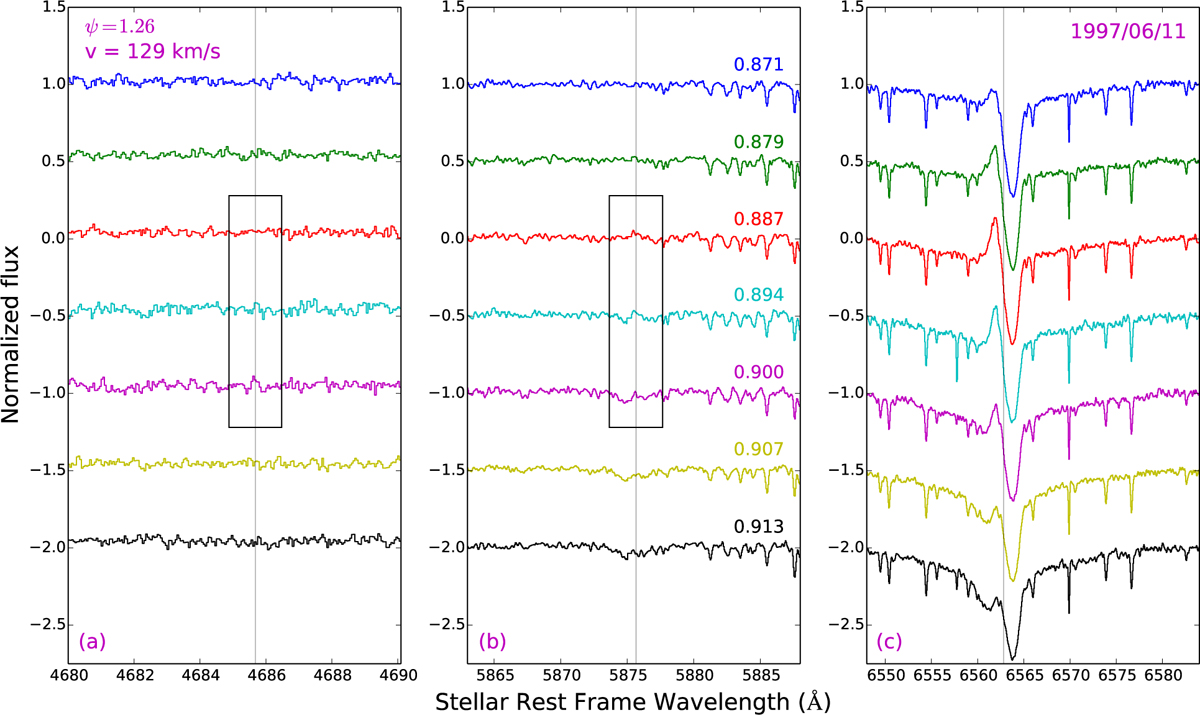
Fig. 6
Download original image
Evolution of the hydrogen and helium emission line profile of RR Lyr during the night of June 11, 1997. Panel a: two consecutive weak He II 4685.68 Å emissions at φ = 0.894 and φ = 0.900 are assumed to be present. Their intensity above the continuum is 6% and 7%, wich is just slightly higher than the D3 He I emission line. Panel b: three consecutive He I 5875.66 Å emissions with an intensity of ∼5% above the continuum are observed, starting at φ = 0.887. Panel c: variation in the Hα profile that reaches 33% above the continuum. The Blazhko phase and the shock velocity are indicated in the top left corner of panel a) and the pulsation phase is shown in the left corner above each spectrum in panel b). The laboratory wavelength of the spectral line of interest is marked by a vertical line in each panel.
Current usage metrics show cumulative count of Article Views (full-text article views including HTML views, PDF and ePub downloads, according to the available data) and Abstracts Views on Vision4Press platform.
Data correspond to usage on the plateform after 2015. The current usage metrics is available 48-96 hours after online publication and is updated daily on week days.
Initial download of the metrics may take a while.