Open Access
Fig. 4
Download original image
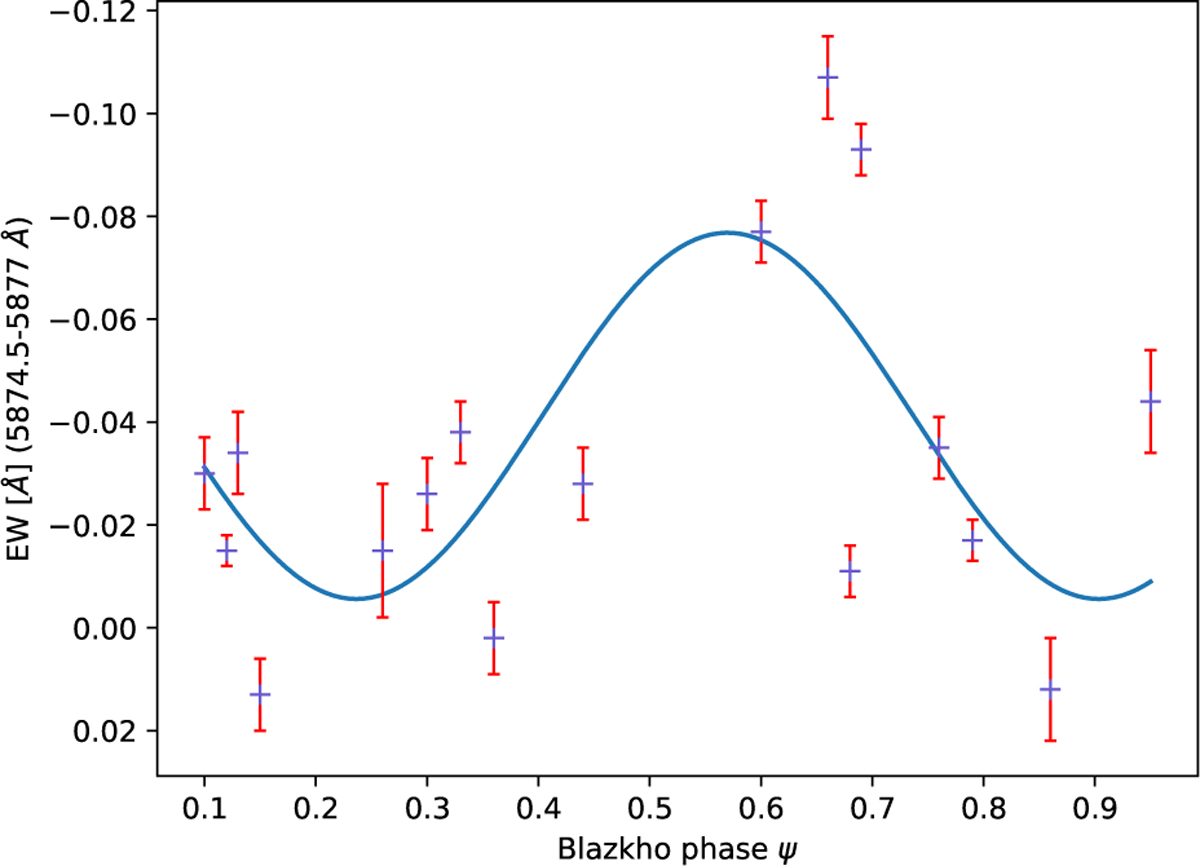
Equivalent width evolution of He I (5875.66 Å) emission line component measured at each pulsation maxima in the 1994–1997 dataset. The integration width is between 5874.5–5877 Å, where EW < 0 corresponds to emission contributions. A fitting with a sine function shows the EW trend with a maximum at ψ ≈ 0.56 ± 0.04.
Current usage metrics show cumulative count of Article Views (full-text article views including HTML views, PDF and ePub downloads, according to the available data) and Abstracts Views on Vision4Press platform.
Data correspond to usage on the plateform after 2015. The current usage metrics is available 48-96 hours after online publication and is updated daily on week days.
Initial download of the metrics may take a while.