Fig. 2
Download original image
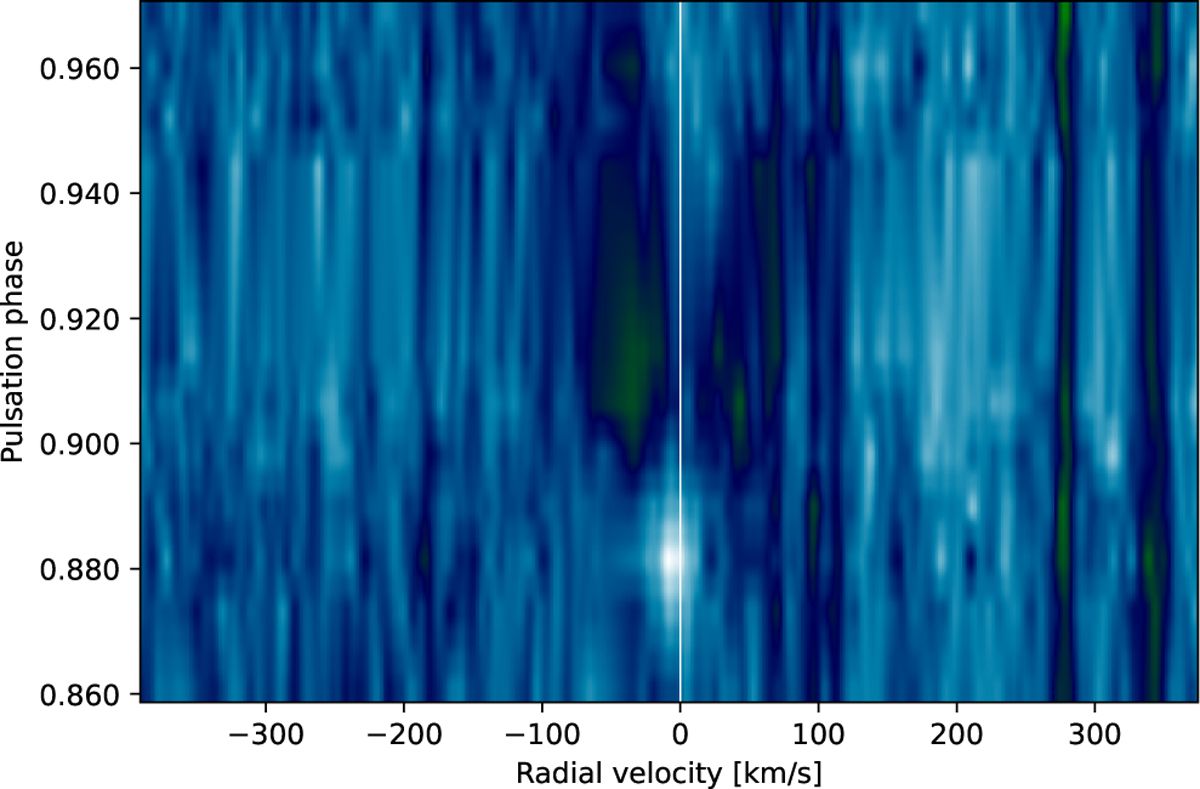
Dynamical spectrum of the time series of the He I λ5875.66 (D3) line profile of RR Lyr corresponding to the night of August 1, 1996 (ψ = 1.10). This figure highlights the second emission of the D3 line with a P Cygni profile (0.920 ≤ φ ≤ 0.965) that follows the first emission (0.860 ≤ φ ≤ 0.900). The absorption component in dark green is located at about −38 km s−1 from the emission component that rose from φ ≃ 0.925 to φ ≃ 0.970. The vertical dark features are telluric lines. The velocities are given in the stellar rest frame, and positive velocities correspond to inward motion (toward the photosphere). The pulsation phases are shown on the left side.
Current usage metrics show cumulative count of Article Views (full-text article views including HTML views, PDF and ePub downloads, according to the available data) and Abstracts Views on Vision4Press platform.
Data correspond to usage on the plateform after 2015. The current usage metrics is available 48-96 hours after online publication and is updated daily on week days.
Initial download of the metrics may take a while.