Fig. 1
Download original image
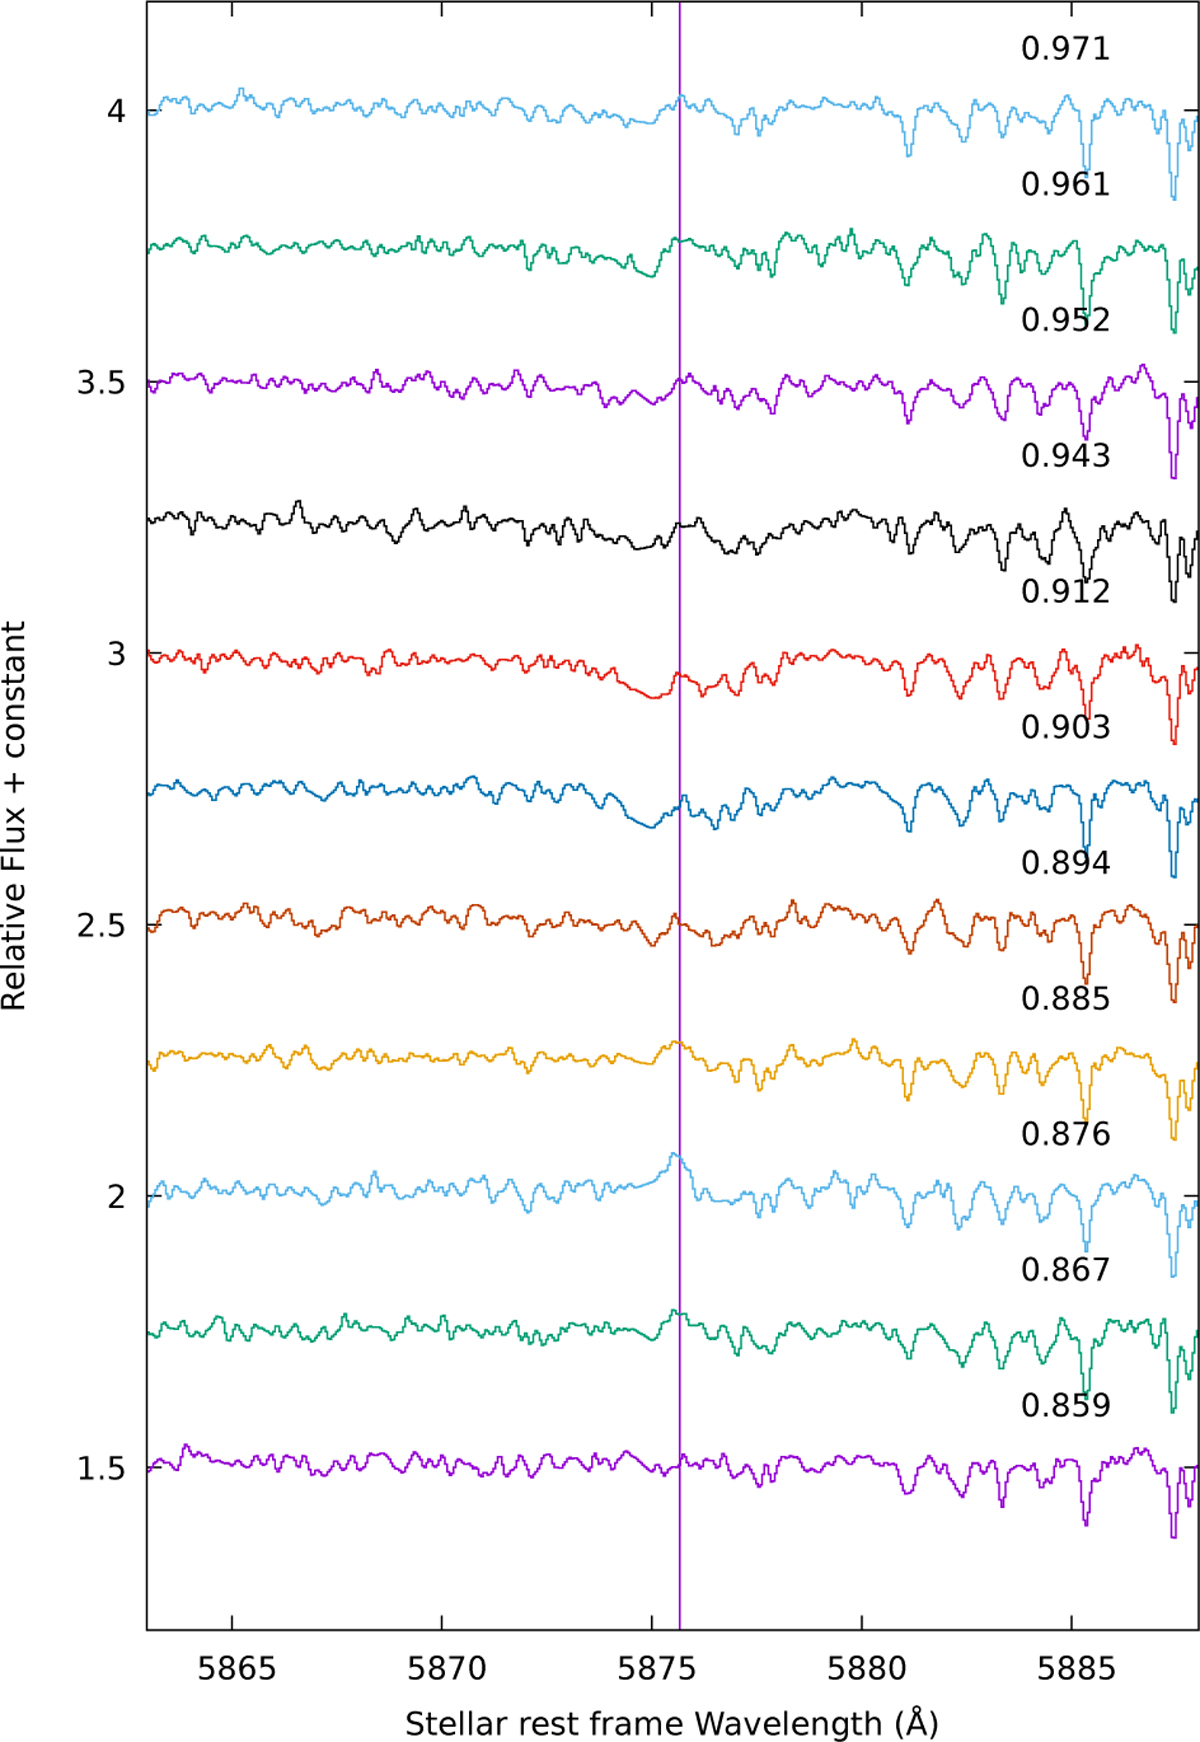
Evolution of the He I λ5875.66 (D3) line profile of RR Lyr corresponding to the night of August 1, 1996 (ψ = 1.10), within the pulsation phase indicated on the right side. The first D3 line emission is visible between 0.859 ≤ φ ≤ 0.894 and is followed by the P Cygni profile (second D3 emission) between 0.903 ≤ φ ≤ 0.961. The exposure time was 300 s, and the absorption lines beyond 5880 Å are telluric lines. The vertical line represents the D3 line laboratory wavelength. The profiles are presented in the stellar rest frame and are arbitrarily shifted in flux for visibility.
Current usage metrics show cumulative count of Article Views (full-text article views including HTML views, PDF and ePub downloads, according to the available data) and Abstracts Views on Vision4Press platform.
Data correspond to usage on the plateform after 2015. The current usage metrics is available 48-96 hours after online publication and is updated daily on week days.
Initial download of the metrics may take a while.