Fig. 4.
Download original image
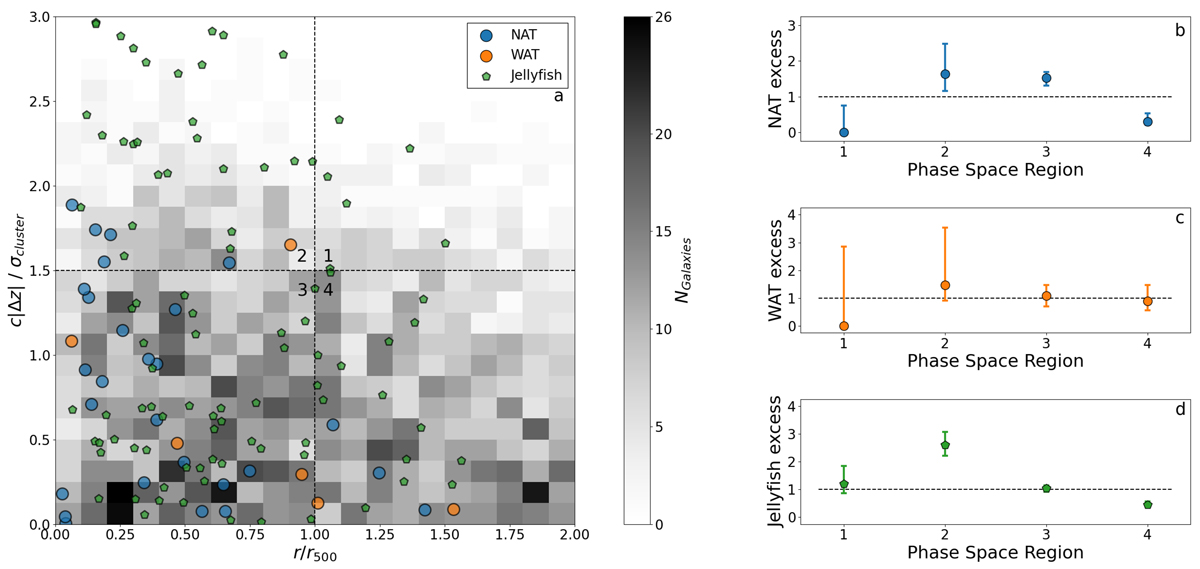
Cluster phase-space diagram, showing excess for tailed radio galaxies. We show NATs and WATs in blue and orange, respectively. Panel (a): Phase-space diagram showing WATs, NATs, and jellyfish galaxies. In the background, the numbers of galaxies from HeCS-SZ (Rines et al. 2016) are given as a reference. The dashed lines show the difference between the four different phase-space regions. Panel (b)–(d): Excess for NATs, WATs, and jellyfish galaxies as defined in Equation (2). The dashed line represents no excess. The error bars are the 1σ statistical uncertainty following Roberts et al. (2021a).
Current usage metrics show cumulative count of Article Views (full-text article views including HTML views, PDF and ePub downloads, according to the available data) and Abstracts Views on Vision4Press platform.
Data correspond to usage on the plateform after 2015. The current usage metrics is available 48-96 hours after online publication and is updated daily on week days.
Initial download of the metrics may take a while.