Fig. 3.
Download original image
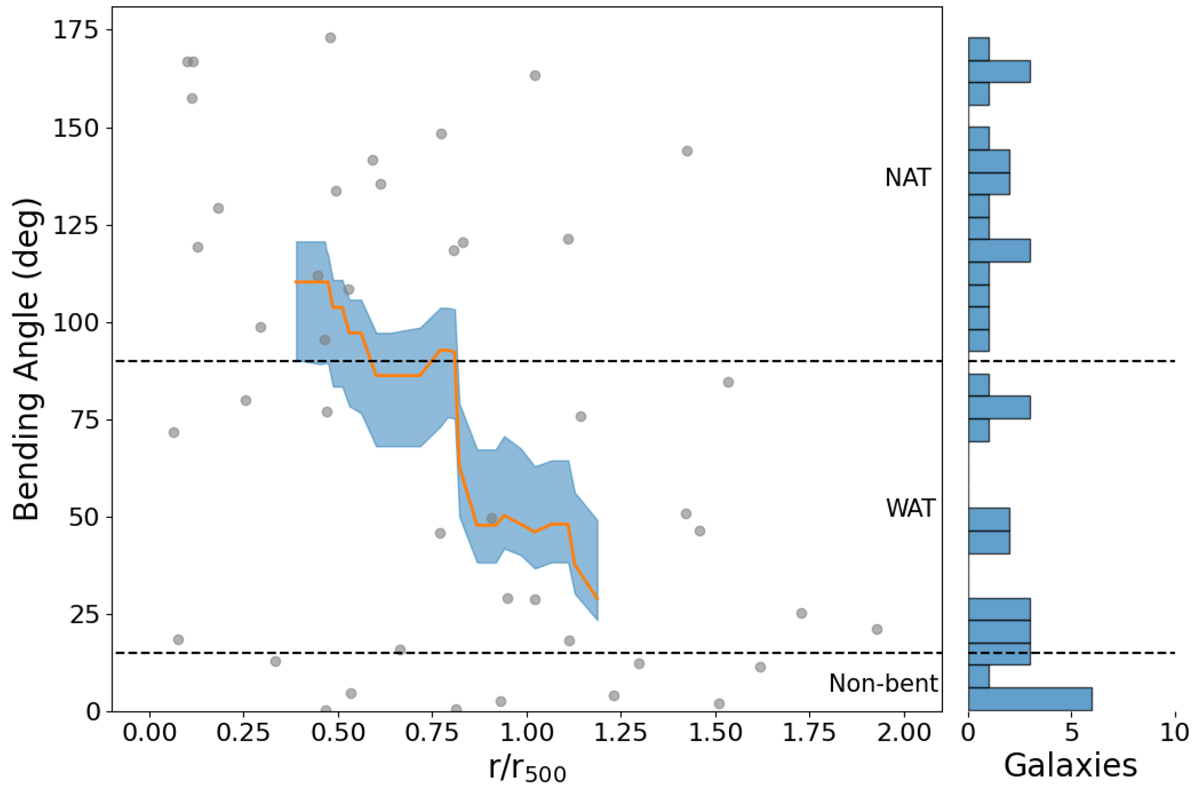
Tailed radio galaxy bending angle plotted against distance from the cluster centre, normalised by r500. The grey markers show the individual tailed radio galaxies. Tailed radio galaxies above (below) the dashed line at 90° are classified as NATs (WATs). The red line shows the running median. To calculate the running median, we followed Lamee et al. (2016) and calculated the running median in bins of N = 20 galaxies. The blue shaded area displays the 1σ statistical uncertainty on the running median, calculated as ![]() , where M is the running median and p16 and p84 are the 16 and 84 percentiles.
, where M is the running median and p16 and p84 are the 16 and 84 percentiles.
Current usage metrics show cumulative count of Article Views (full-text article views including HTML views, PDF and ePub downloads, according to the available data) and Abstracts Views on Vision4Press platform.
Data correspond to usage on the plateform after 2015. The current usage metrics is available 48-96 hours after online publication and is updated daily on week days.
Initial download of the metrics may take a while.