Fig. 1.
Download original image
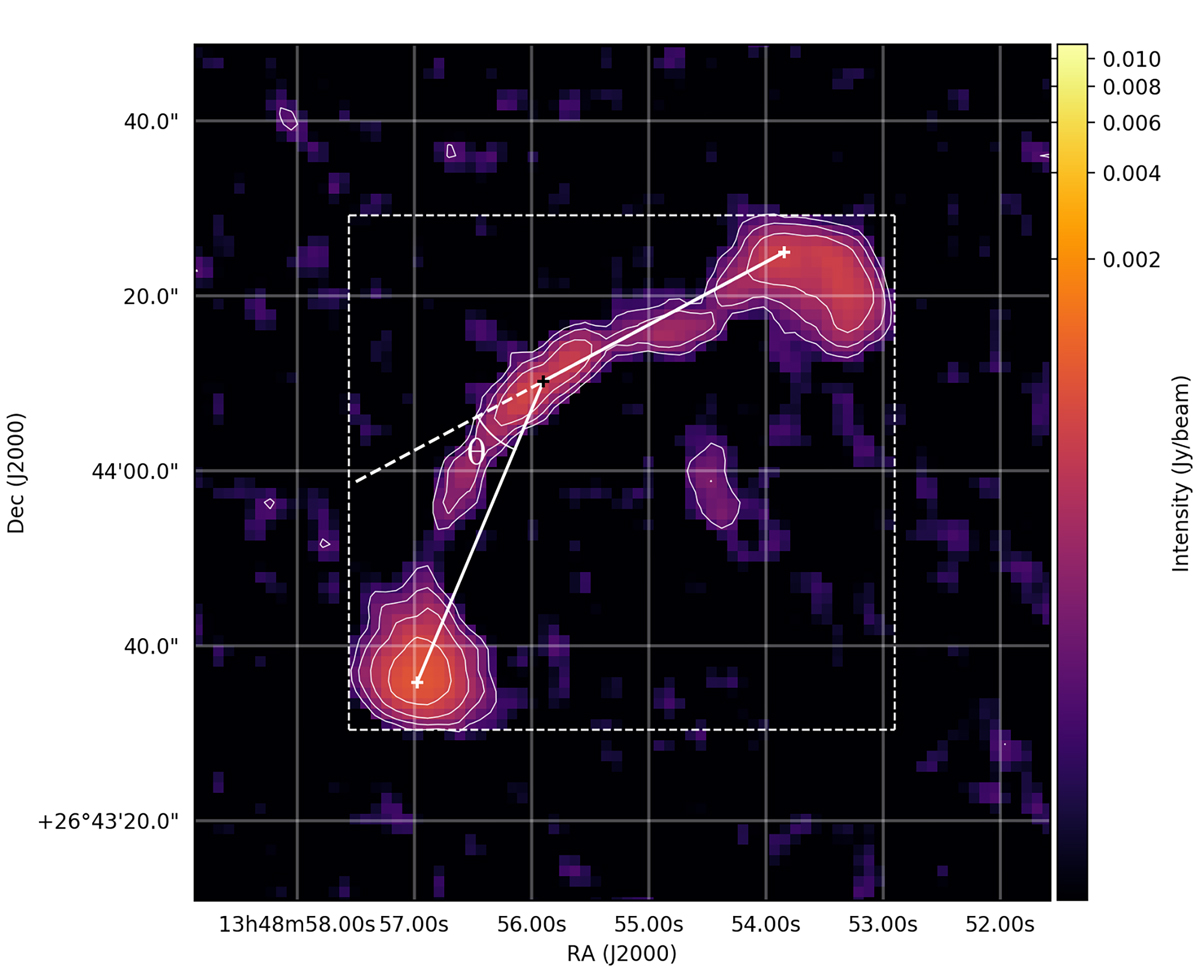
Example of how bending angle and size are measured. The black ‘+’ shows the location of the optical counterpart, and the white ‘+’ shows the location of the highest radio intensities in the lobes. The white lines connect the location with the optical counterparts with the highest intensities, which are used to calculate the bending angle θ. The dashed lines show the fitted box around the edges of the 3σ contours used to calculate the size of the source.
Current usage metrics show cumulative count of Article Views (full-text article views including HTML views, PDF and ePub downloads, according to the available data) and Abstracts Views on Vision4Press platform.
Data correspond to usage on the plateform after 2015. The current usage metrics is available 48-96 hours after online publication and is updated daily on week days.
Initial download of the metrics may take a while.