Open Access
Fig. 9
Download original image
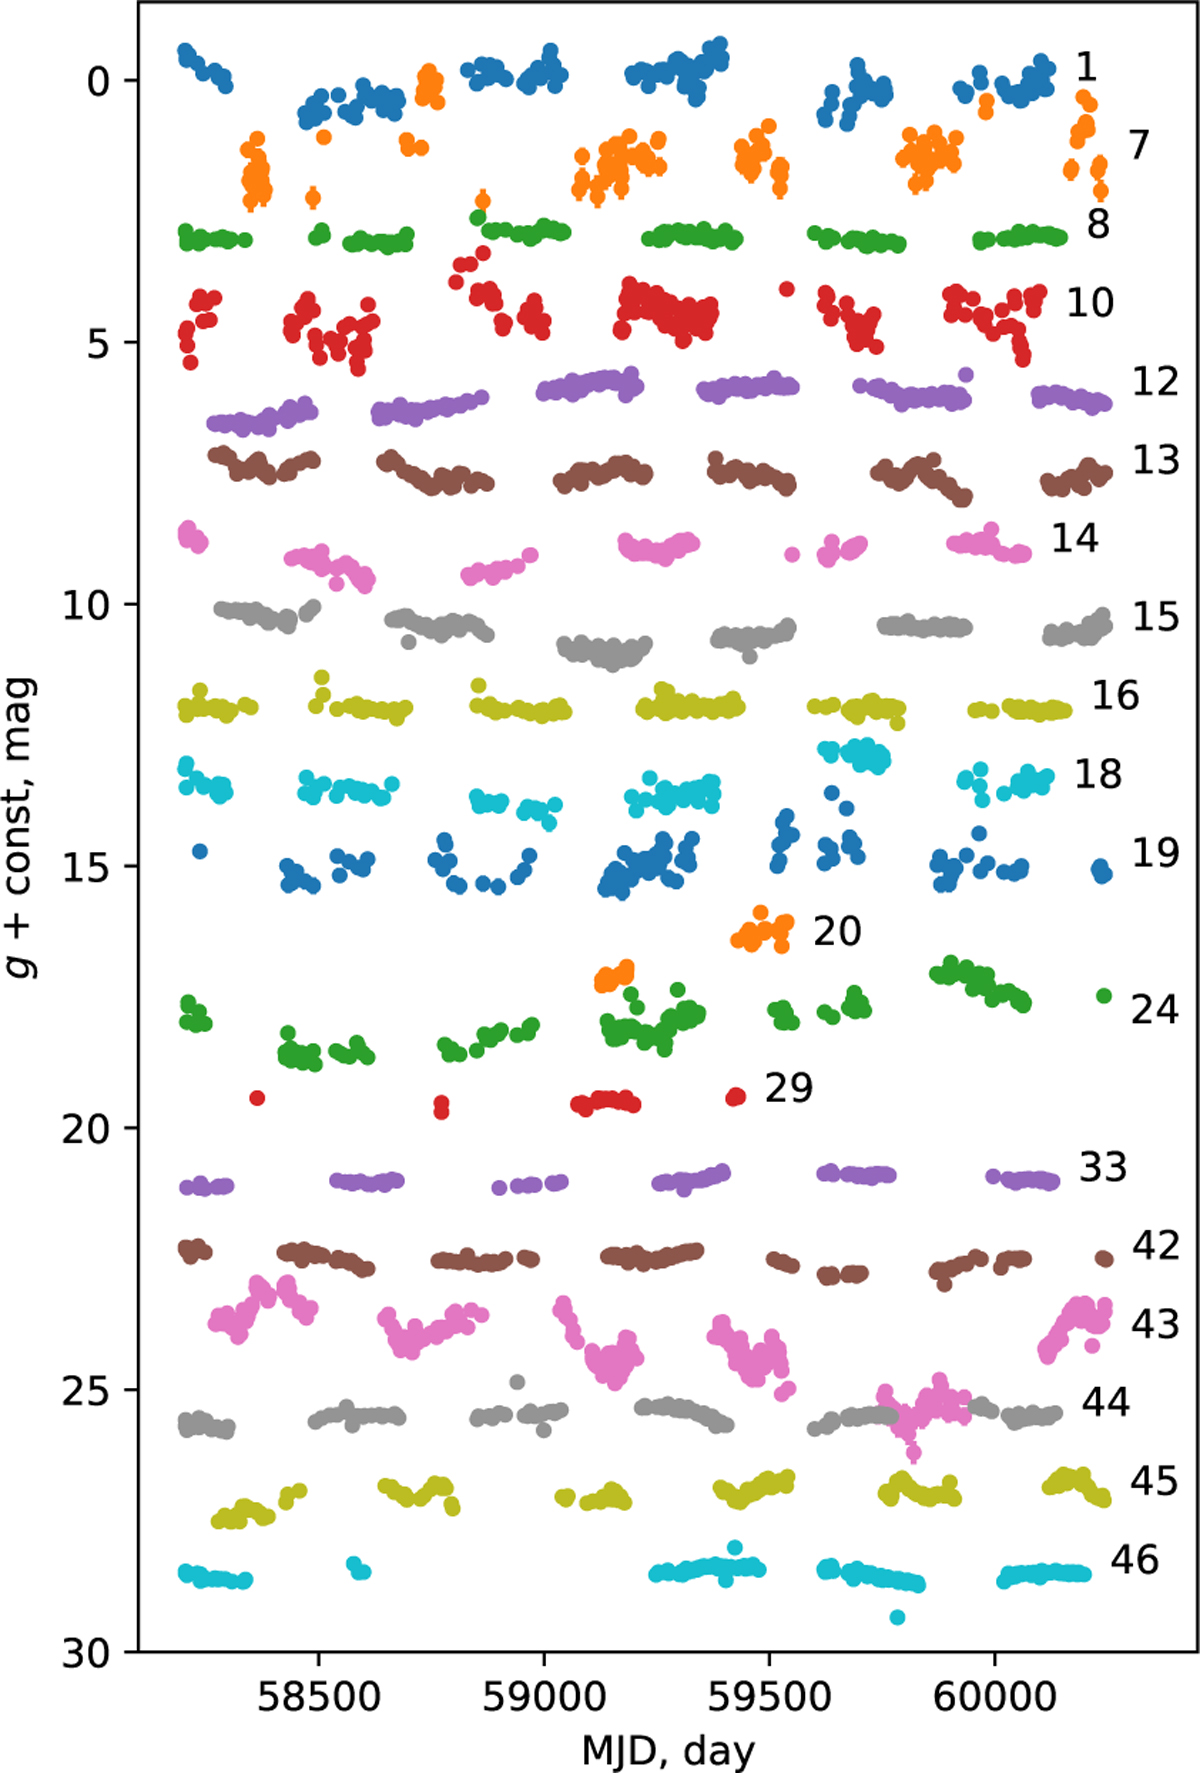
ZTF g- band light curves of subset of most variable Quaia quasars according to the 2MASS-versus-VHS magnitude differences. The number on the right corresponds to the sequential number in Table 3. The observational error bars are smaller than the symbols.
Current usage metrics show cumulative count of Article Views (full-text article views including HTML views, PDF and ePub downloads, according to the available data) and Abstracts Views on Vision4Press platform.
Data correspond to usage on the plateform after 2015. The current usage metrics is available 48-96 hours after online publication and is updated daily on week days.
Initial download of the metrics may take a while.