Fig. 8
Download original image
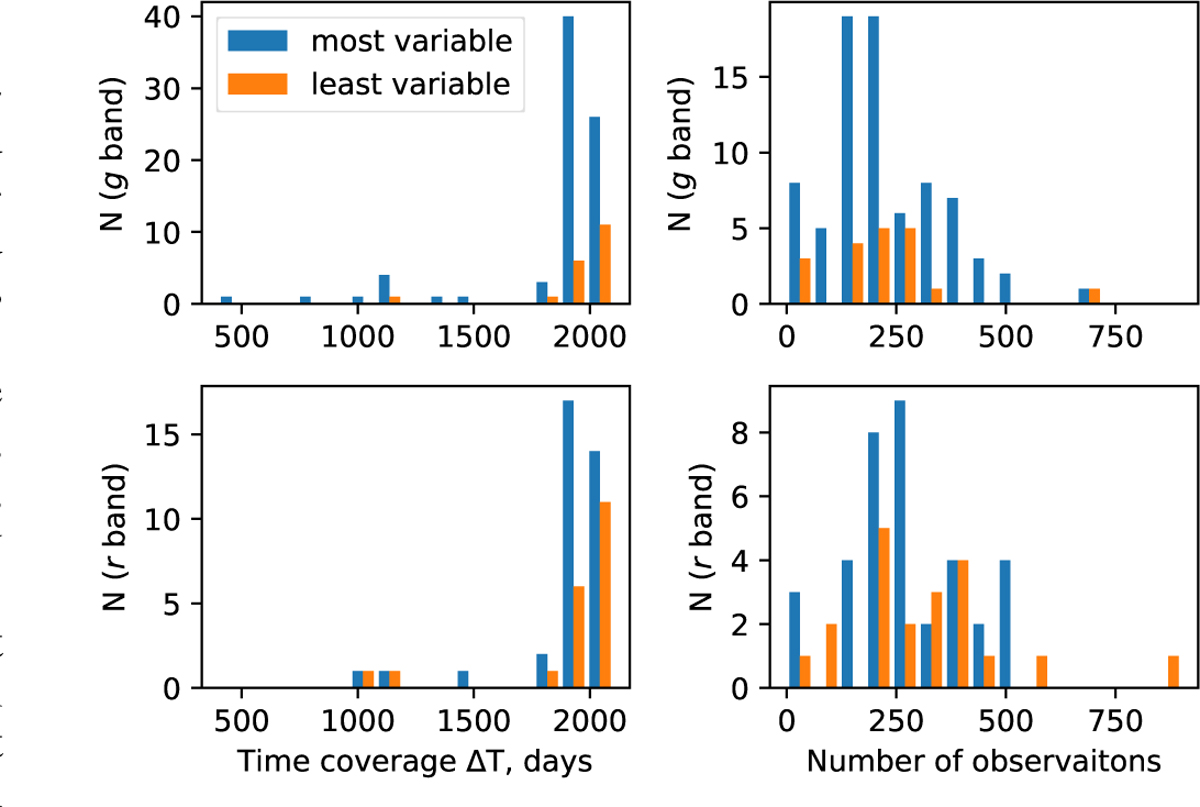
Properties of optical ZTF light curves for the most variable 80 (blue) and for the least variable 20 objects (orange) in our sample. Only optical light curves with at least three observations are included here, which reduces these numbers. Left: histograms of time coverage of light curves for g (top) and r (bottom) filters. Right: same plots for the number of observations.
Current usage metrics show cumulative count of Article Views (full-text article views including HTML views, PDF and ePub downloads, according to the available data) and Abstracts Views on Vision4Press platform.
Data correspond to usage on the plateform after 2015. The current usage metrics is available 48-96 hours after online publication and is updated daily on week days.
Initial download of the metrics may take a while.