Fig. 7
Download original image
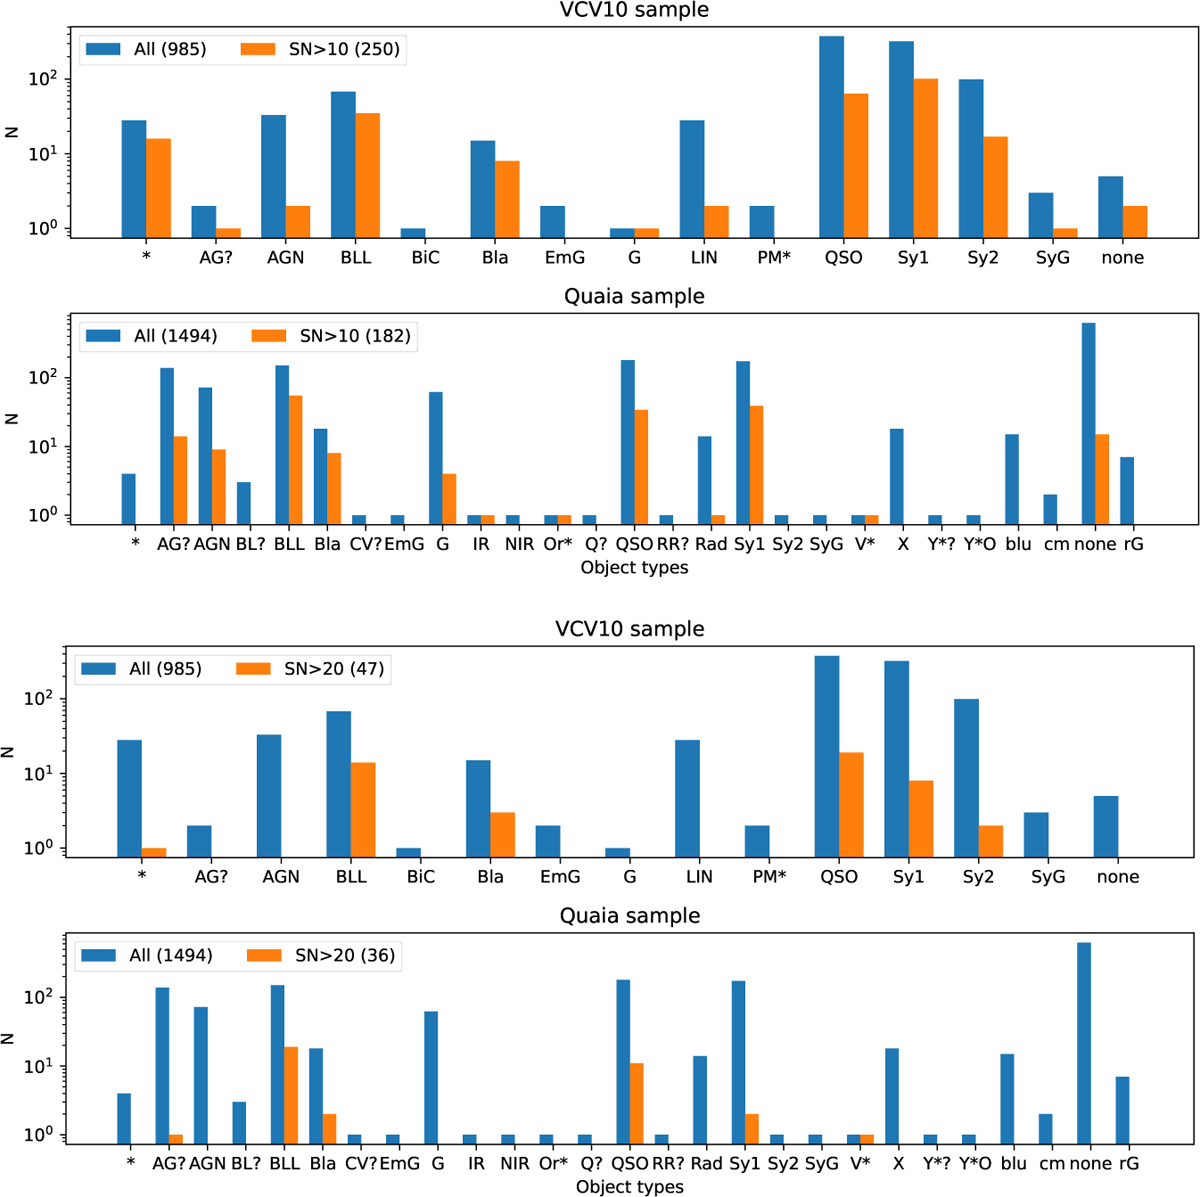
Distributions of SIMBAD object types for VCV10 and Quaia (top and bottom, alternating) samples for different variability levels: the blue histograms show the complete samples and the orange histograms show extremely variable objects with average changes in J and K that exceed 10- and 20-σ significance levels (upper and lower pair of panels). Bracketed numbers in the legends show the number of objects in each set. The bin for objects with no SIMBAD classification is marked with ‘none’.
Current usage metrics show cumulative count of Article Views (full-text article views including HTML views, PDF and ePub downloads, according to the available data) and Abstracts Views on Vision4Press platform.
Data correspond to usage on the plateform after 2015. The current usage metrics is available 48-96 hours after online publication and is updated daily on week days.
Initial download of the metrics may take a while.