Fig. 3

Download original image
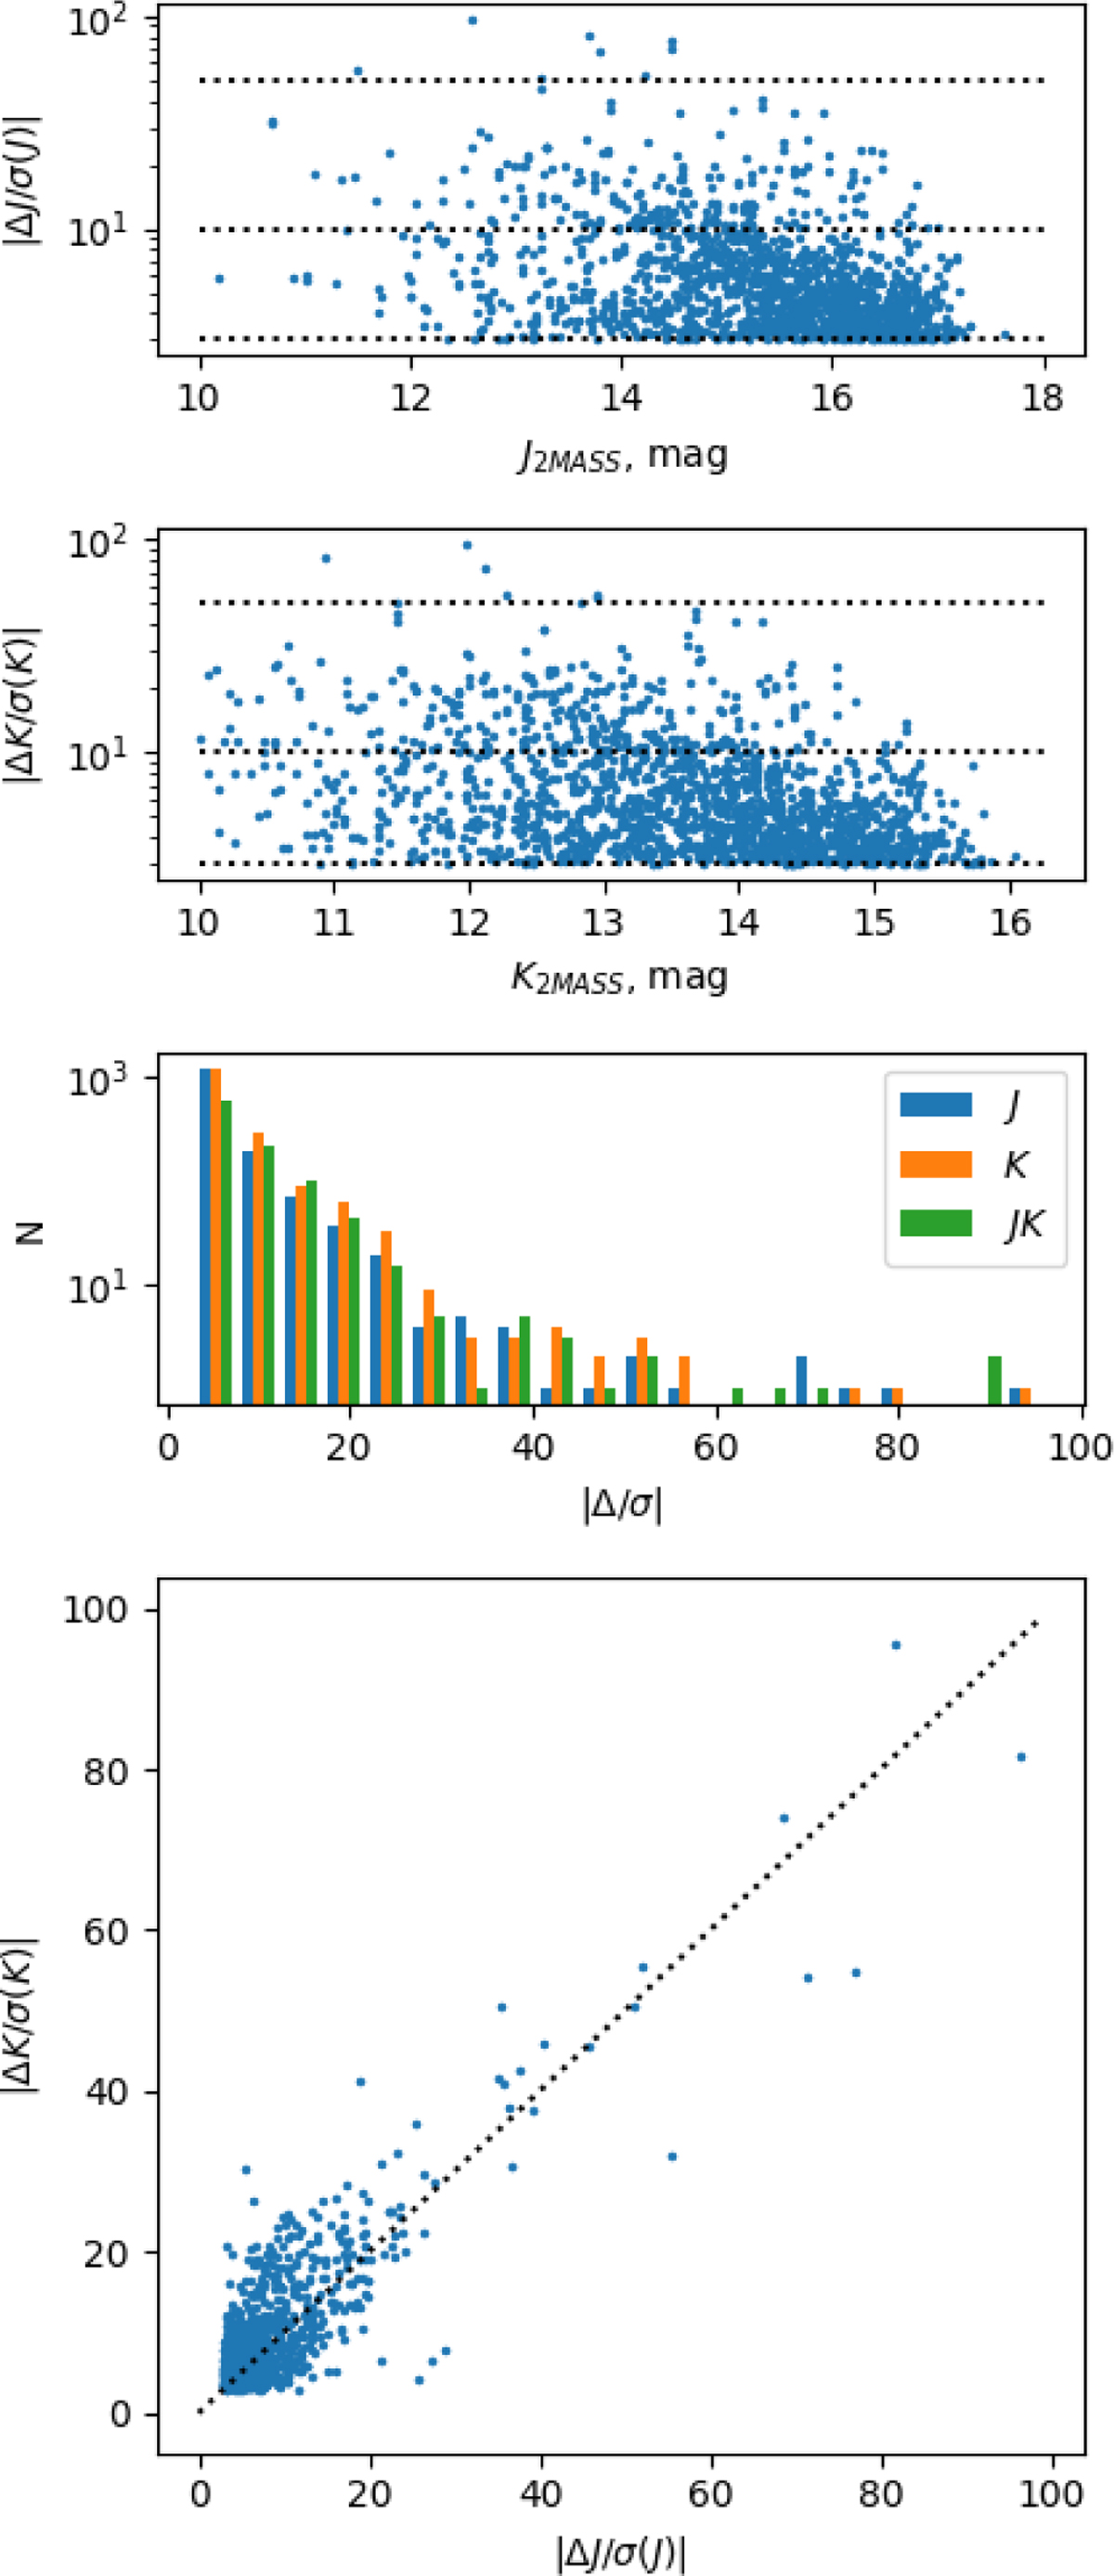
Variability properties of quasars in VCV10 sample. The top panels show the 2MASS versus VHS magnitude change in J and K in units-of-measurement errors added in quadrature from the two surveys. The third panel is the histogram of these deviations for J, K, and the average of the two. The bottom panel plots the normalised deviations in the two bands against each other; the dotted line corresponds to the slope of unity.
Current usage metrics show cumulative count of Article Views (full-text article views including HTML views, PDF and ePub downloads, according to the available data) and Abstracts Views on Vision4Press platform.
Data correspond to usage on the plateform after 2015. The current usage metrics is available 48-96 hours after online publication and is updated daily on week days.
Initial download of the metrics may take a while.


