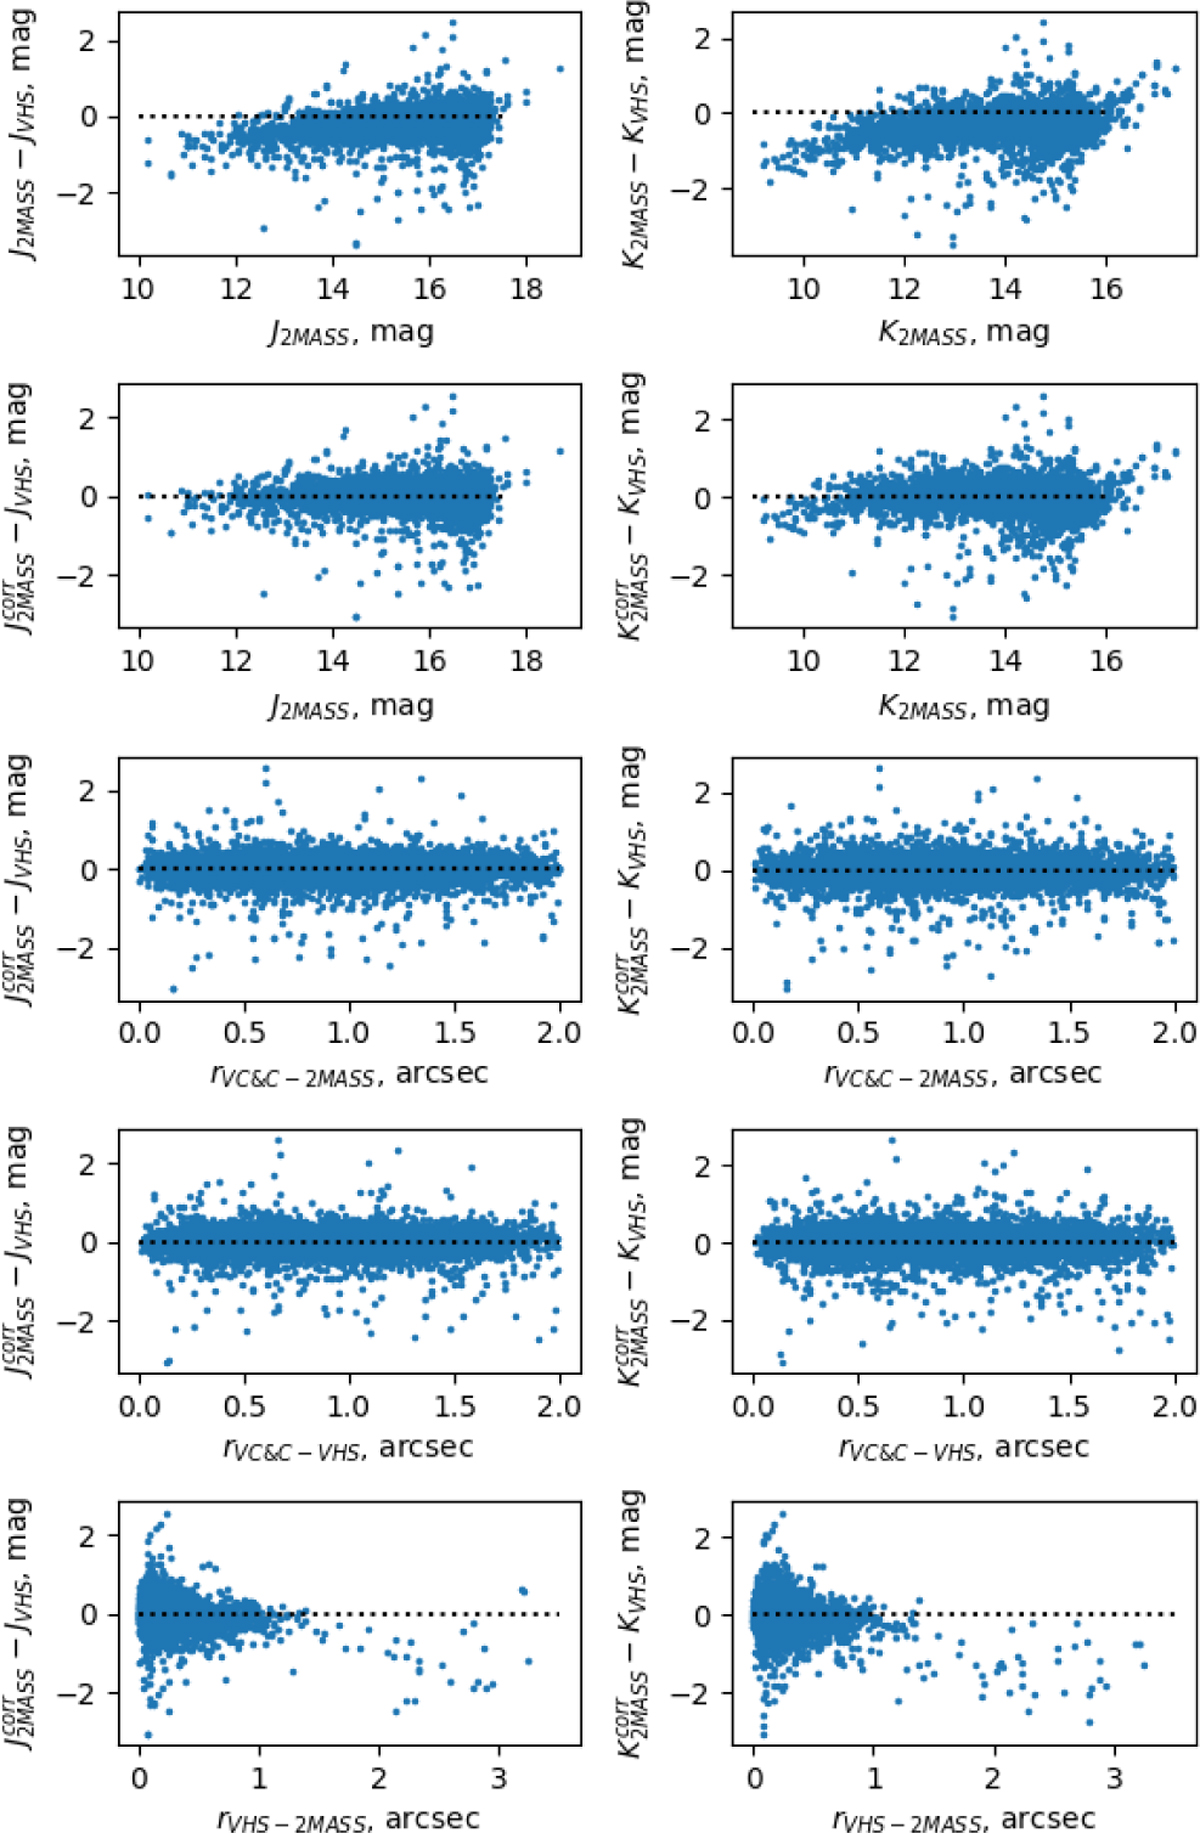
Fig. 1
Download original image
Matching 2MASS and VHS sources. The conversion of the 2MASS to the VHS photometric system is illustrated in the first two rows: the panels in the top row show the magnitude differences for the sample quasars before the correction and the second two rows display the differences after the conversion according to Eq. (1) and Table 1. The deviation at sources brighter than ∼11 mag is related to the saturation in VHS. The astrometric properties are illustrated in the remaining three rows, showing the magnitude differences as a function of the angular separation between VCV10 and 2MASS coordinates, between VCV10 and VHS coordinates, and between the 2MASS and VHS coordinates (top to bottom). Panels on the left are for J, and those on the right are for the K band.
Current usage metrics show cumulative count of Article Views (full-text article views including HTML views, PDF and ePub downloads, according to the available data) and Abstracts Views on Vision4Press platform.
Data correspond to usage on the plateform after 2015. The current usage metrics is available 48-96 hours after online publication and is updated daily on week days.
Initial download of the metrics may take a while.