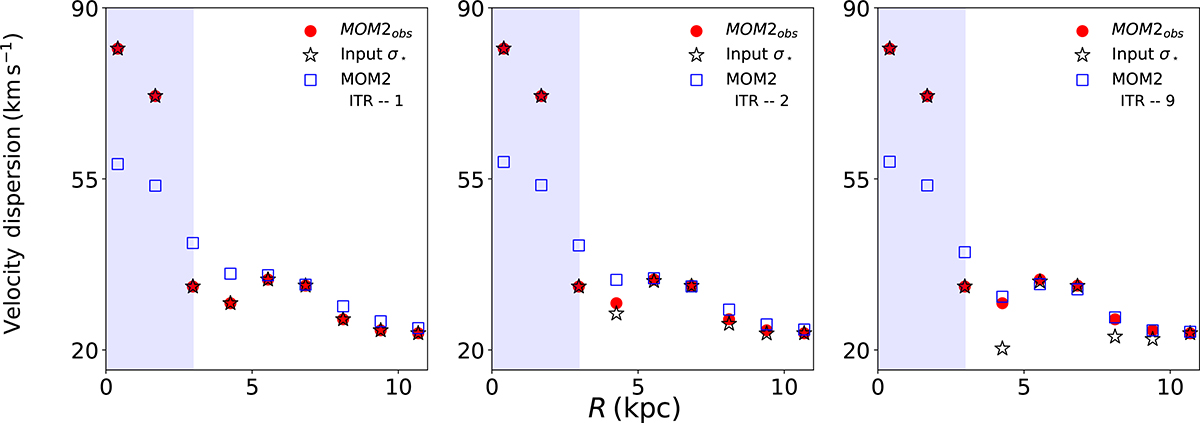
Fig. 6.
Download original image
Illustration of the iterative method workflow. In each panel, the red circles represent the observed MOM2; the blue squares denote the simulated MOM2; and the black asterisks indicate the input intrinsic stellar velocity dispersion, σ⋆. The shaded region represents radii to which we do not apply iterative method. The left panel shows the results for the first iteration, whereas the middle and the right panel show the results for second and ninth iteration. The iterative method for NGC 551 quickly converged within ten iterations. See the text for more details.
Current usage metrics show cumulative count of Article Views (full-text article views including HTML views, PDF and ePub downloads, according to the available data) and Abstracts Views on Vision4Press platform.
Data correspond to usage on the plateform after 2015. The current usage metrics is available 48-96 hours after online publication and is updated daily on week days.
Initial download of the metrics may take a while.