Open Access
Fig. 5.
Download original image
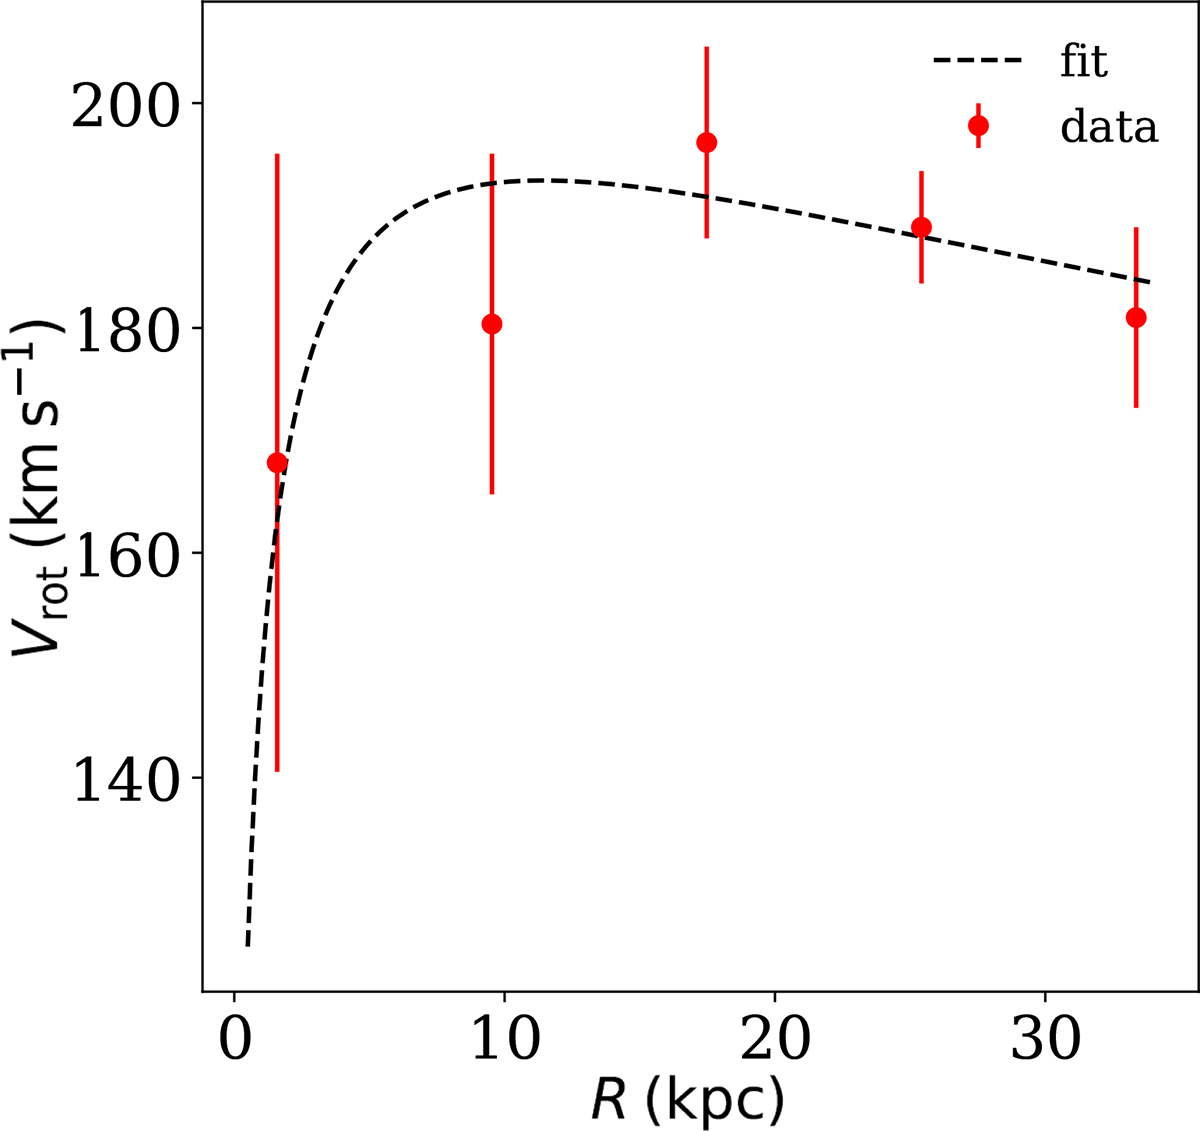
Rotation curve of NGC 551 derived from the H I spectral cube. The FAT pipeline was used to produce the rotation curve. The red circles with error bars represent the rotation curve, whereas the dashed black line signifies a fit to the rotation curve with a Brandt profile.
Current usage metrics show cumulative count of Article Views (full-text article views including HTML views, PDF and ePub downloads, according to the available data) and Abstracts Views on Vision4Press platform.
Data correspond to usage on the plateform after 2015. The current usage metrics is available 48-96 hours after online publication and is updated daily on week days.
Initial download of the metrics may take a while.