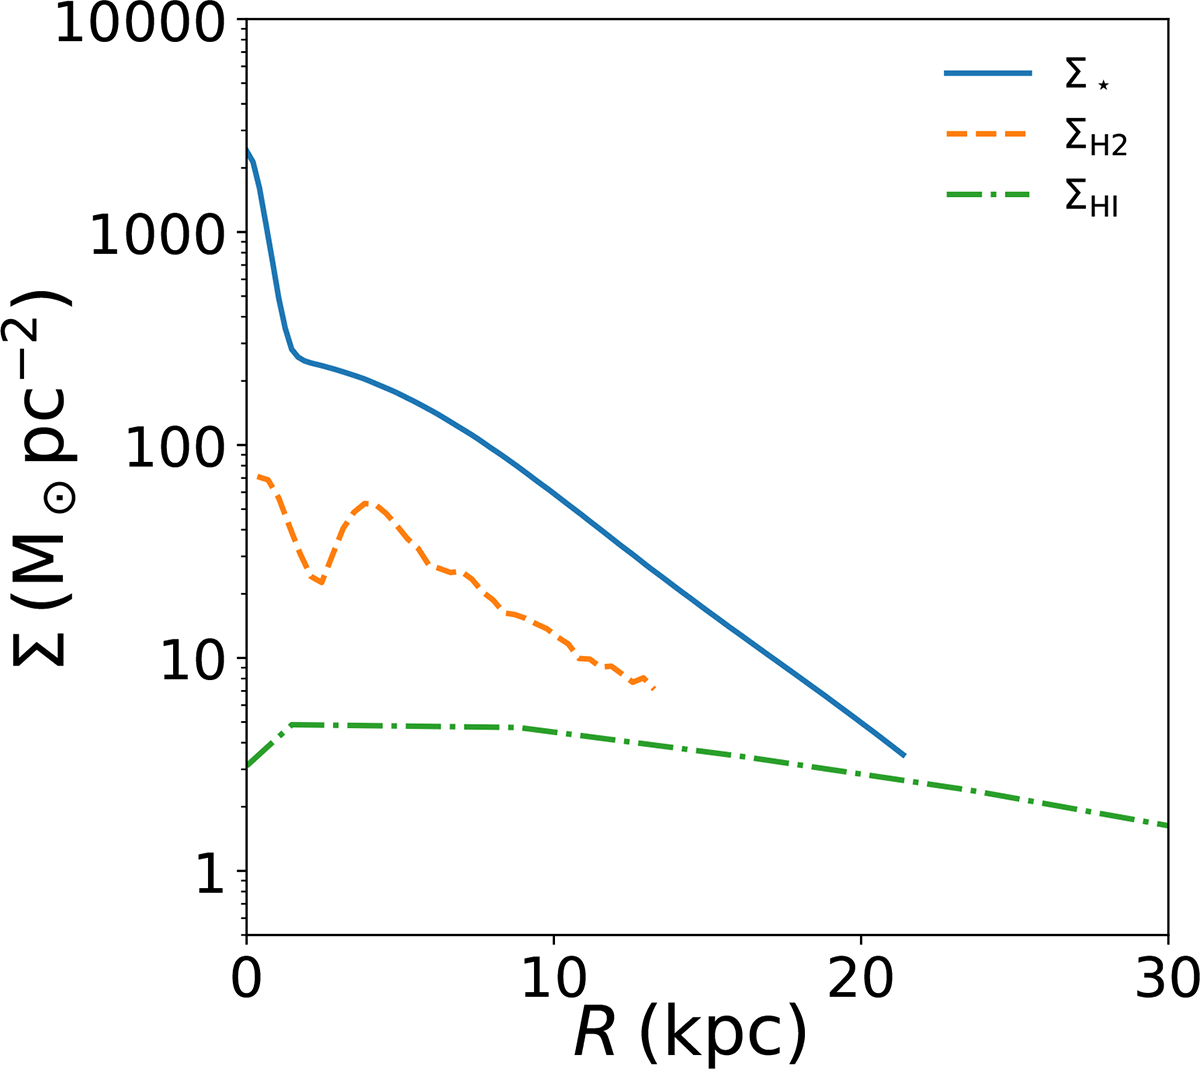
Fig. 2.
Download original image
Deprojected surface density profiles of different disks in NGC 551. The solid blue line represents the stellar surface density, whereas the dashed orange and dashed-dotted green lines represent the molecular and atomic gas surface density profiles, respectively. The stellar surface density profile was obtained using the Spitzer 3.6 μm map and MGE fitting. The ΣH2 is measured from maps from Bolatto et al. (2017). The ΣHI profile is obtained through a 3D tilted ring model fitting of the H I spectral cube obtained through the uGMRT (Swarup et al. 1991; Gupta et al. 2017) observation. See the text for more details.
Current usage metrics show cumulative count of Article Views (full-text article views including HTML views, PDF and ePub downloads, according to the available data) and Abstracts Views on Vision4Press platform.
Data correspond to usage on the plateform after 2015. The current usage metrics is available 48-96 hours after online publication and is updated daily on week days.
Initial download of the metrics may take a while.