Fig. 17.
Download original image
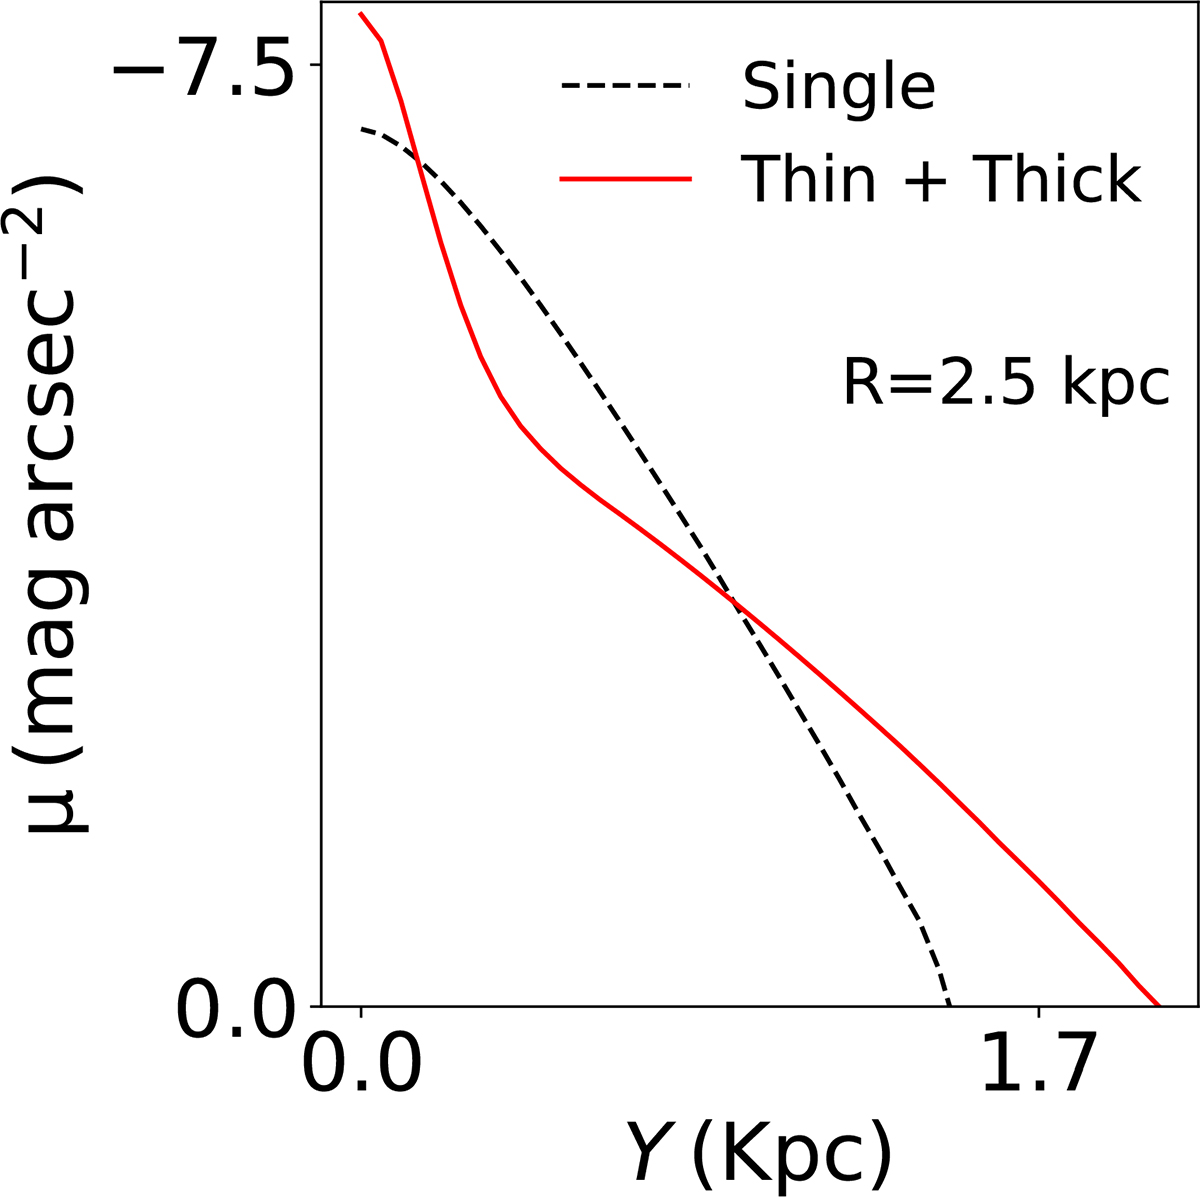
Vertical cuts of the simulated intensity distributions of the stellar disk in an edge-on orientation plotted on a logarithmic scale and at a radius of 2.5 kpc. The dashed black line represents the single-component disk, whereas the solid red line represents a two-component disk. An up-bending break appears only in the two-component disk.
Current usage metrics show cumulative count of Article Views (full-text article views including HTML views, PDF and ePub downloads, according to the available data) and Abstracts Views on Vision4Press platform.
Data correspond to usage on the plateform after 2015. The current usage metrics is available 48-96 hours after online publication and is updated daily on week days.
Initial download of the metrics may take a while.