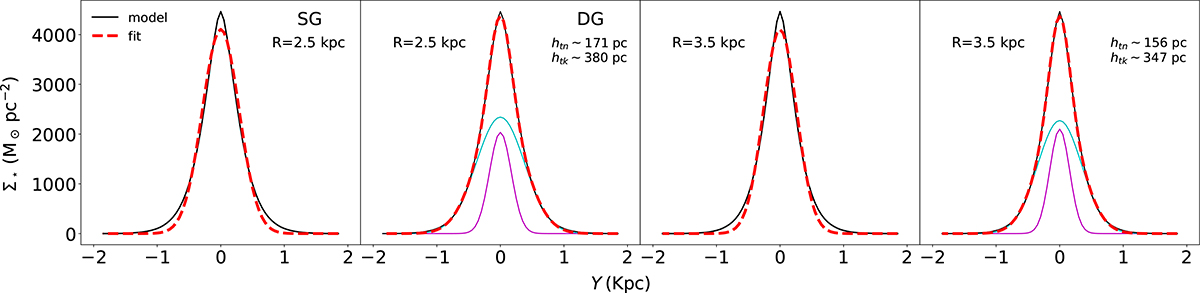
Fig. 16.
Download original image
Vertical cuts of the simulated intensity distribution of the stellar disk in an edge-on orientation and its fit with single and double Gaussian components. The first two panels show vertical cuts at a radius of 2.5 kpc, and the last two panels show cuts at a radius of 3.5 kpc. The solid black lines represent the vertical cuts of the edge-on intensity profiles. The dashed red lines represent the fits. The first and third panels show a single Gaussian fit, whereas the second and fourth panels show a double Gaussian fit. The double Gaussian fits represent the data better, despite having a single-component disk.
Current usage metrics show cumulative count of Article Views (full-text article views including HTML views, PDF and ePub downloads, according to the available data) and Abstracts Views on Vision4Press platform.
Data correspond to usage on the plateform after 2015. The current usage metrics is available 48-96 hours after online publication and is updated daily on week days.
Initial download of the metrics may take a while.