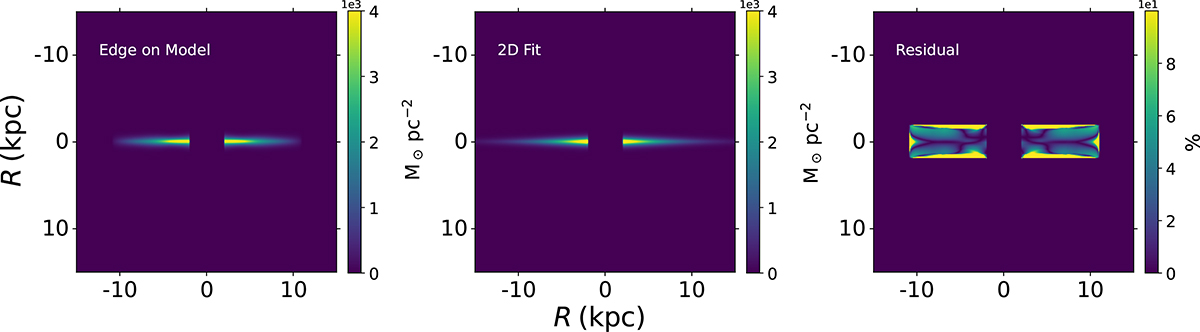
Fig. 14.
Download original image
Surface brightness map of the stellar disk in NGC 551 in an edge-on orientation. The left panel shows the surface brightness map, whereas the middle panel represents a 2D fit to the map (using Eq. 14). The right panel shows the residual of the fitting. The masked portion in the middle of each panel represents the region where we did not solve the hydrostatic equilibrium equation. The 2D fit describes the simulated data reasonably well.
Current usage metrics show cumulative count of Article Views (full-text article views including HTML views, PDF and ePub downloads, according to the available data) and Abstracts Views on Vision4Press platform.
Data correspond to usage on the plateform after 2015. The current usage metrics is available 48-96 hours after online publication and is updated daily on week days.
Initial download of the metrics may take a while.