Open Access
Fig. 4.
Download original image
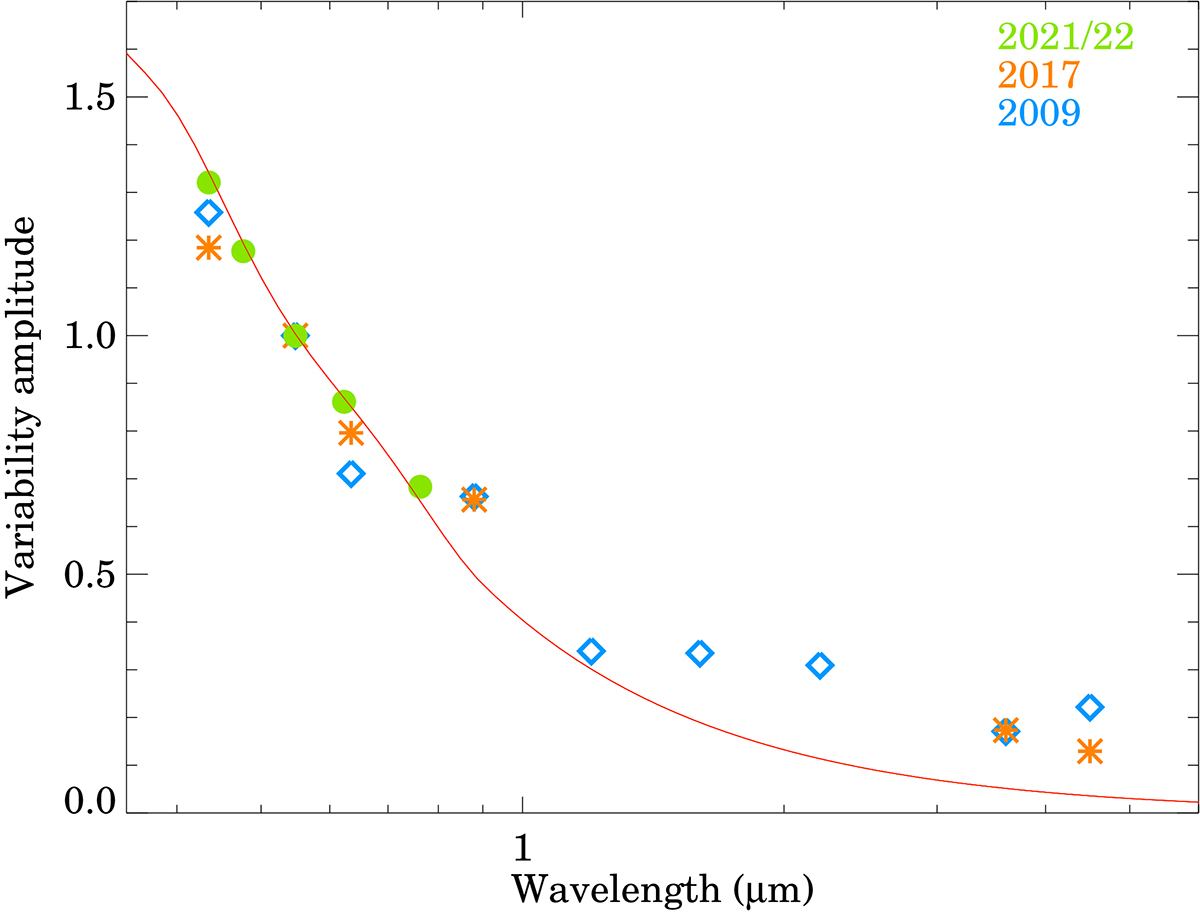
Variability amplitudes measured at all wavelengths. The 2021/22 data are shown with green, the 2017 data are plotted with orange, and the 2009 data are indicated with blue symbols. The interstellar reddening law (Cardelli et al. 1989), normalized to the V-band, is overplotted with a red curve.
Current usage metrics show cumulative count of Article Views (full-text article views including HTML views, PDF and ePub downloads, according to the available data) and Abstracts Views on Vision4Press platform.
Data correspond to usage on the plateform after 2015. The current usage metrics is available 48-96 hours after online publication and is updated daily on week days.
Initial download of the metrics may take a while.