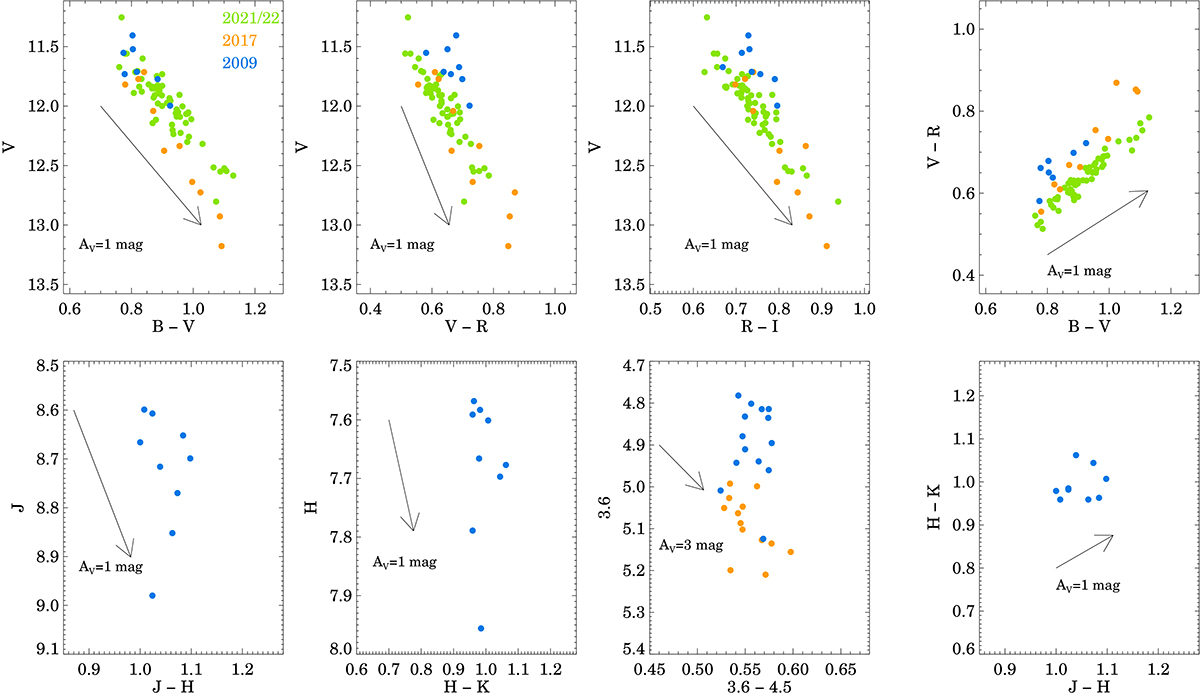
Fig. 3.
Download original image
Color-magnitude and color-color diagrams of DR Tau. The filled blue circles show the data obtained in 2009, the filled orange circles indicate the 2017 data, and the green circles display the 2021/22 data. We note that, for better comparability, the 2021/2022 data in the V−R vs. V and the R−I vs. V diagrams were converted from the Sloan r and i filters to the Cousins RC and IC filters using the relations by Jordi et al. (2006). The black arrows in each panel indicate a change corresponding to AV = 1 mag, except for the 3.6−4.5 vs. 3.6 mid-infrared color-magnitude diagram, where it corresponds to AV = 3 mag.
Current usage metrics show cumulative count of Article Views (full-text article views including HTML views, PDF and ePub downloads, according to the available data) and Abstracts Views on Vision4Press platform.
Data correspond to usage on the plateform after 2015. The current usage metrics is available 48-96 hours after online publication and is updated daily on week days.
Initial download of the metrics may take a while.