Fig. 2.
Download original image
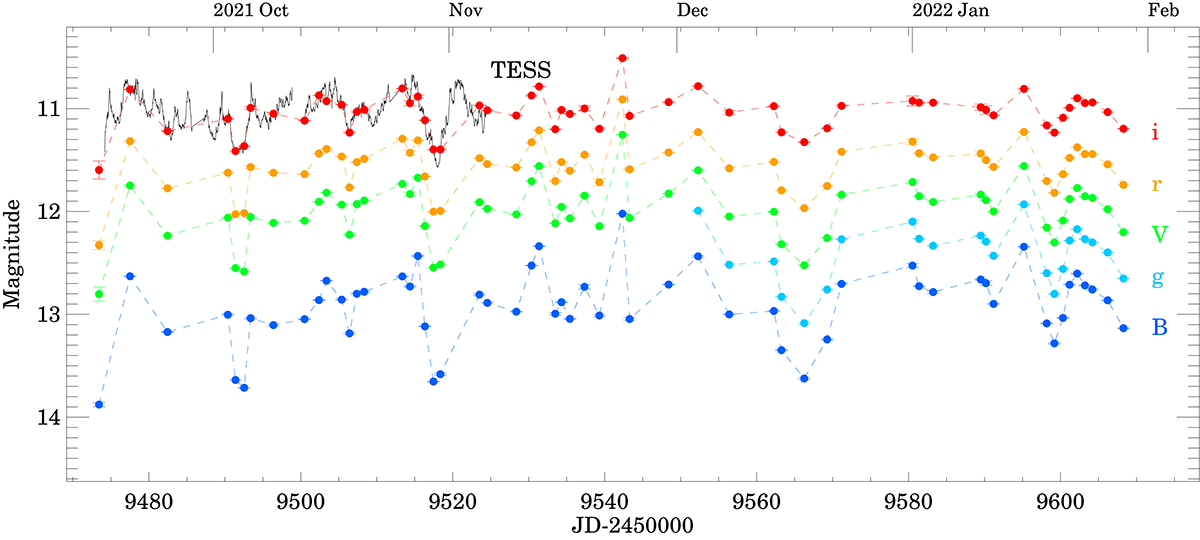
Optical light curves of DR Tau from 2021–2022. The small black dots are the TESS data obtained with a 10-minute cadence, the large filled circles are multifilter optical photometry from the Konkoly Observatory obtained with the RC80 telescope in the BgVri-bands. The long tick marks on the top axis indicate the first day of each month.
Current usage metrics show cumulative count of Article Views (full-text article views including HTML views, PDF and ePub downloads, according to the available data) and Abstracts Views on Vision4Press platform.
Data correspond to usage on the plateform after 2015. The current usage metrics is available 48-96 hours after online publication and is updated daily on week days.
Initial download of the metrics may take a while.