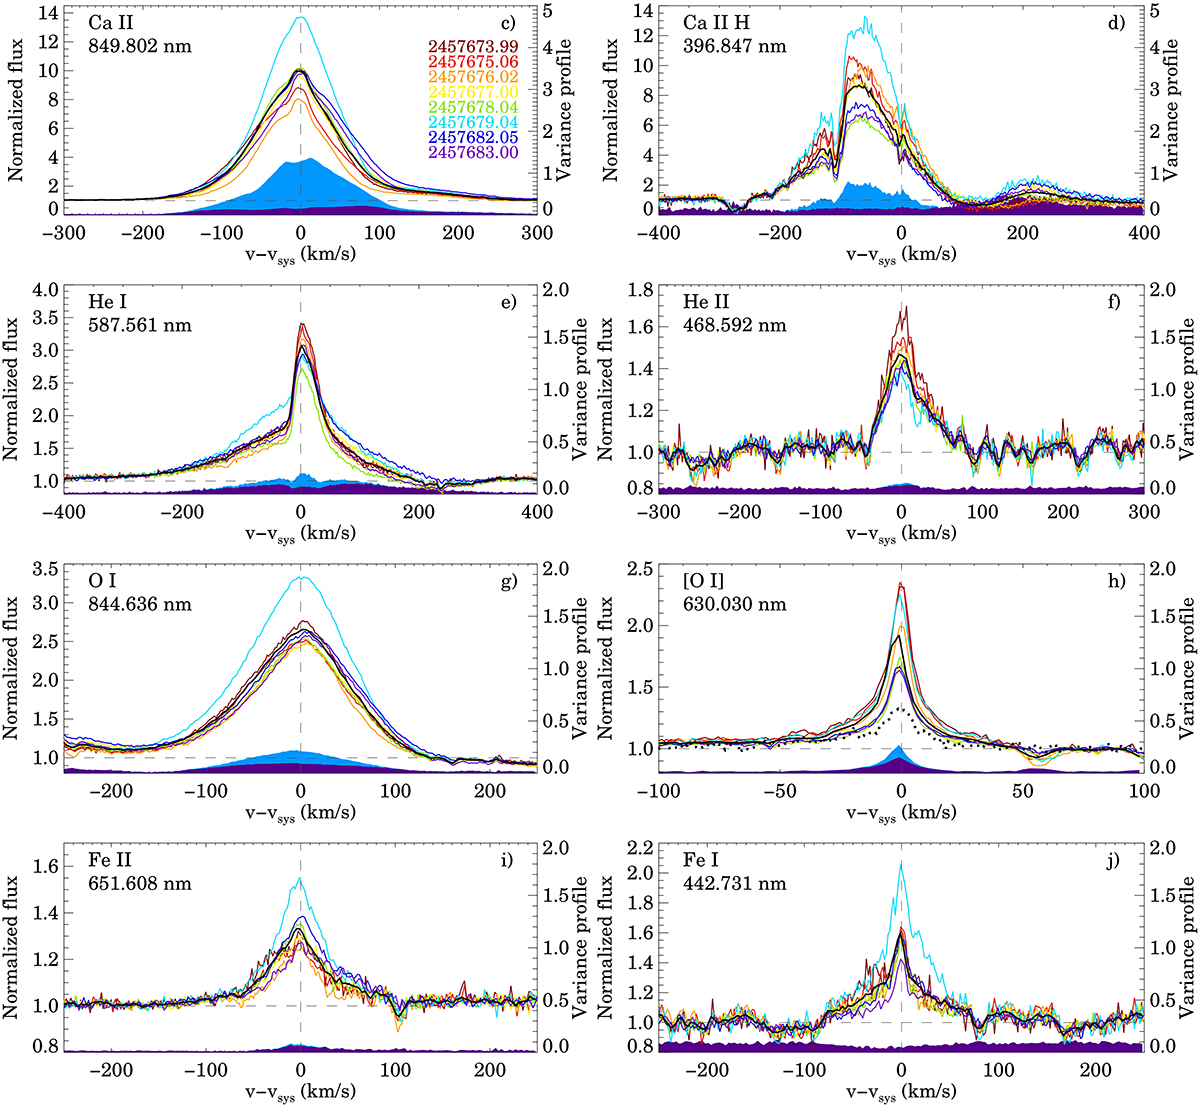
Fig. A.1.
Download original image
Variance profiles of emission lines. The profiles with different colors indicate observations made on the Julian days marked on the first panel. The thick black curve shows the mean line profile, the light blue area is the variance profile, and the dark blue shaded area is the normalized variance profile. The dotted line in panel h indicate data from Banzatti et al. (2019).
Current usage metrics show cumulative count of Article Views (full-text article views including HTML views, PDF and ePub downloads, according to the available data) and Abstracts Views on Vision4Press platform.
Data correspond to usage on the plateform after 2015. The current usage metrics is available 48-96 hours after online publication and is updated daily on week days.
Initial download of the metrics may take a while.