Fig. 12.
Download original image
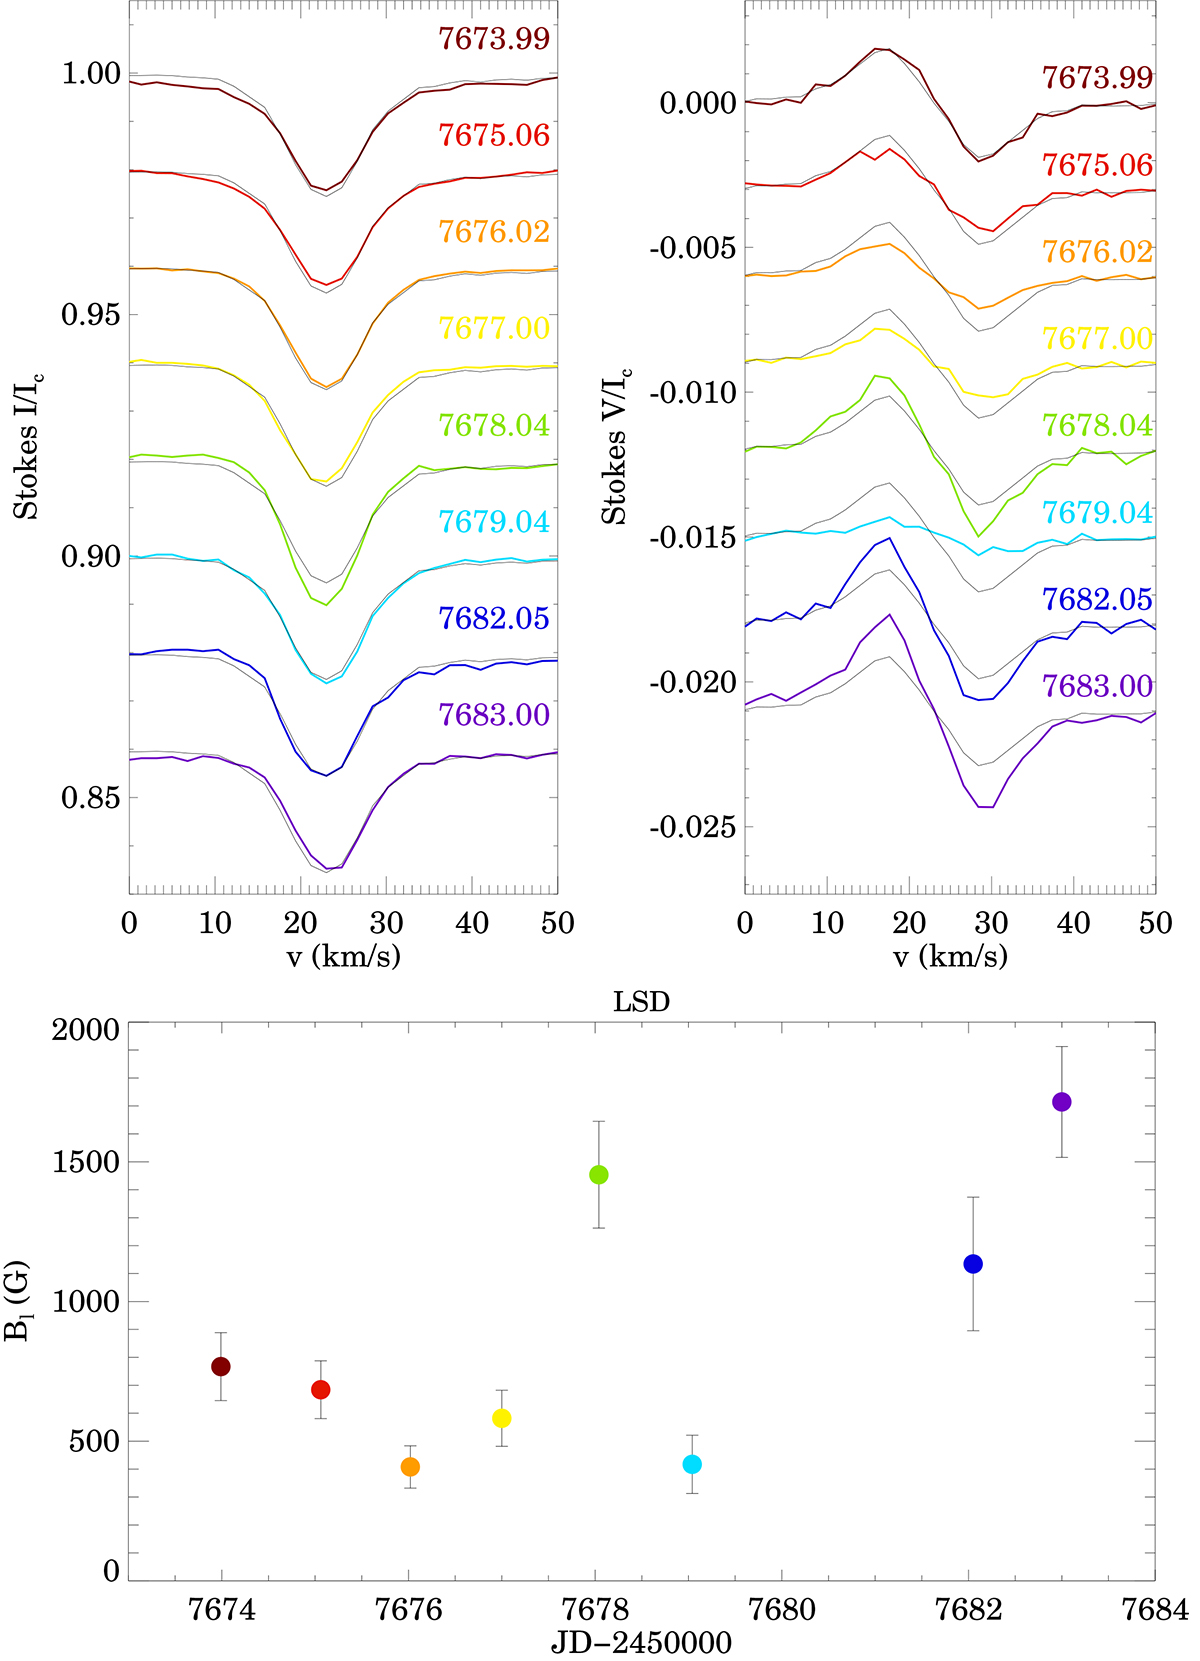
Spectropolarimetric measurements of DR Tau. The top left panel shows the LSD Stokes I profiles, the top right panel shows the Stokes V profiles. The black lines in the top panels are the average line profiles. The lines were shifted along the y axis by an arbitrary value for better display. The bottom panel shows the longitudinal magnetic field as calculated from the LSD profiles.
Current usage metrics show cumulative count of Article Views (full-text article views including HTML views, PDF and ePub downloads, according to the available data) and Abstracts Views on Vision4Press platform.
Data correspond to usage on the plateform after 2015. The current usage metrics is available 48-96 hours after online publication and is updated daily on week days.
Initial download of the metrics may take a while.