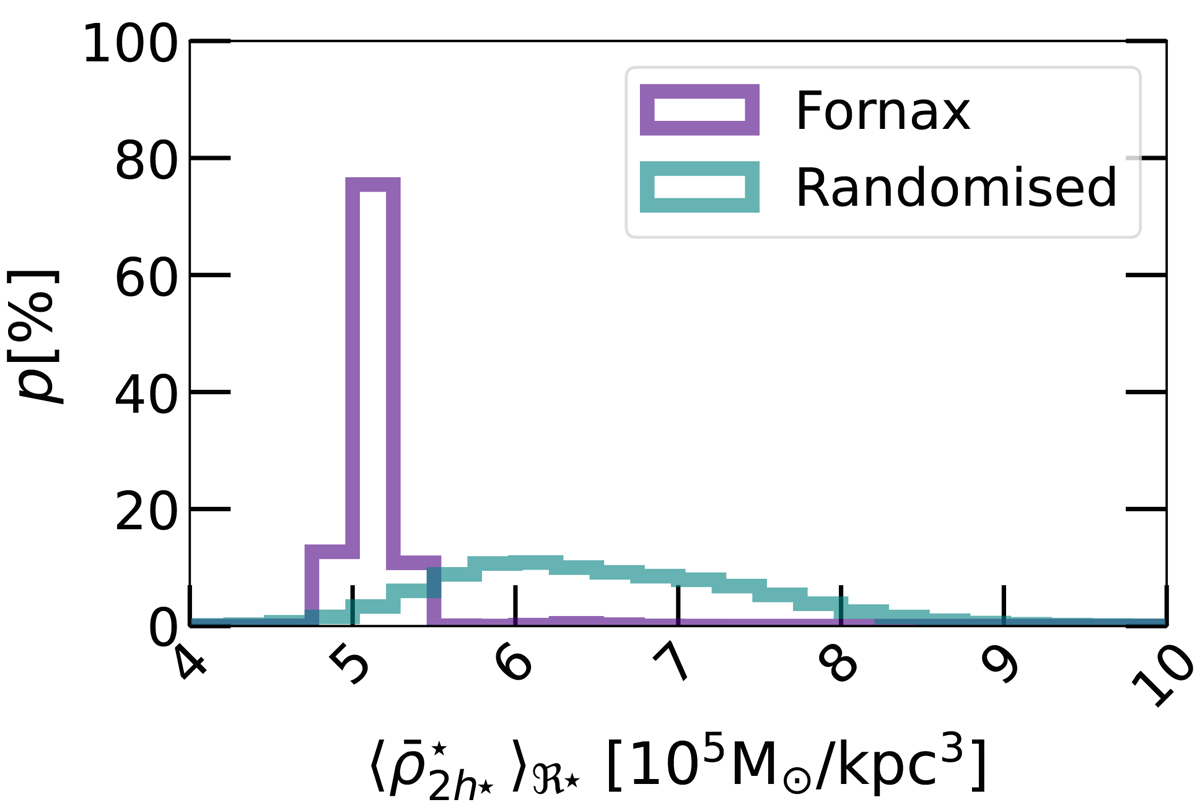
Fig. 8.
Download original image
Null-hypothesis test: Example with the Fornax galaxy cluster. For each of the 106 measurements of ℜ⋆ ([ii]), the corresponding distribution of the minimum values of the moving average curves of the mean stellar mass densities is shown (purple histogram). The distribution of the measurements of ℜ⋆ for the randomised (shuffled) satellite densities (turquoise histogram) is produced by randomly shuffling the density values between the satellites while keeping their spatial positions within Fornax. A more visual comparison is shown in Fig. 6. Using these distributions we calculate that the probability of the randomised distributions resulting in densities as low as or lower than the most probable value measured in Fornax (i.e. ∼ 5.1 × 10⁵ M⊙ kpc−3) is of pNH = 4.0%. We use the same procedure to calculate these probabilities, pNH, for Virgo, MW, M31 and certain simulation examples.
Current usage metrics show cumulative count of Article Views (full-text article views including HTML views, PDF and ePub downloads, according to the available data) and Abstracts Views on Vision4Press platform.
Data correspond to usage on the plateform after 2015. The current usage metrics is available 48-96 hours after online publication and is updated daily on week days.
Initial download of the metrics may take a while.