Fig. 7.
Download original image
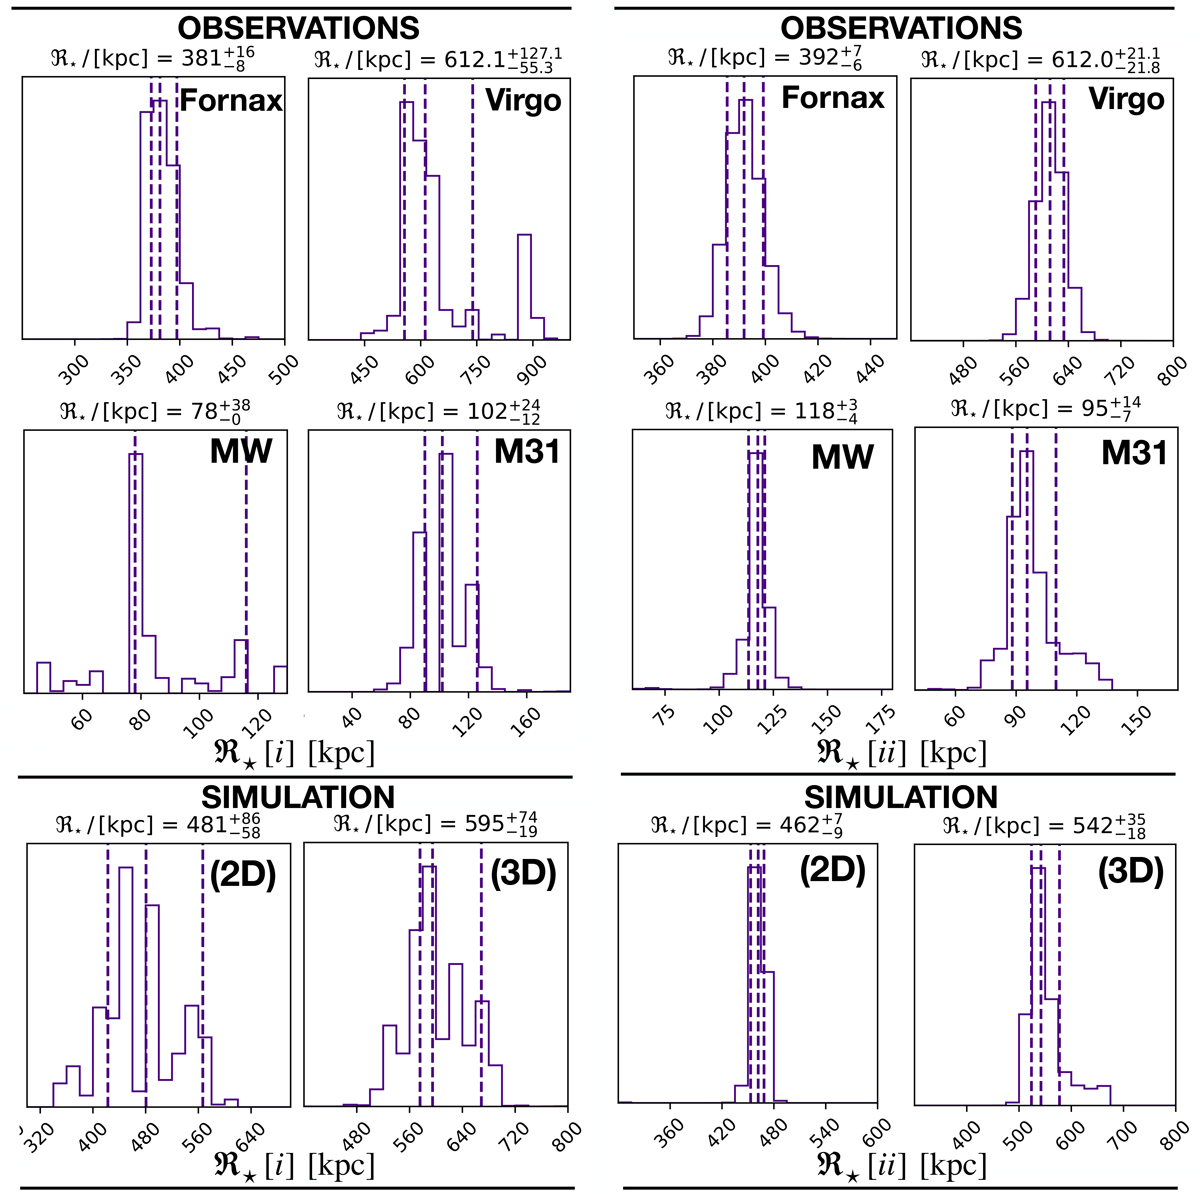
Distribution of measurements of ℜ⋆, marginalising over the distribution of ![]() (minimum in the moving average of the mean stellar mass densities profiles) using methods [i] (left panel) with Eq. (19) and [ii] (right panel) with Eq. (20). The top four rows of panels show the results for the observed systems (Fornax, Virgo, MW, and M31), and the bottom row panels present the simulated TNG50 Fornax-type cluster, with ℜ⋆ measured in projection (2D) and in 3D.
(minimum in the moving average of the mean stellar mass densities profiles) using methods [i] (left panel) with Eq. (19) and [ii] (right panel) with Eq. (20). The top four rows of panels show the results for the observed systems (Fornax, Virgo, MW, and M31), and the bottom row panels present the simulated TNG50 Fornax-type cluster, with ℜ⋆ measured in projection (2D) and in 3D.
Current usage metrics show cumulative count of Article Views (full-text article views including HTML views, PDF and ePub downloads, according to the available data) and Abstracts Views on Vision4Press platform.
Data correspond to usage on the plateform after 2015. The current usage metrics is available 48-96 hours after online publication and is updated daily on week days.
Initial download of the metrics may take a while.