Fig. 6.
Download original image
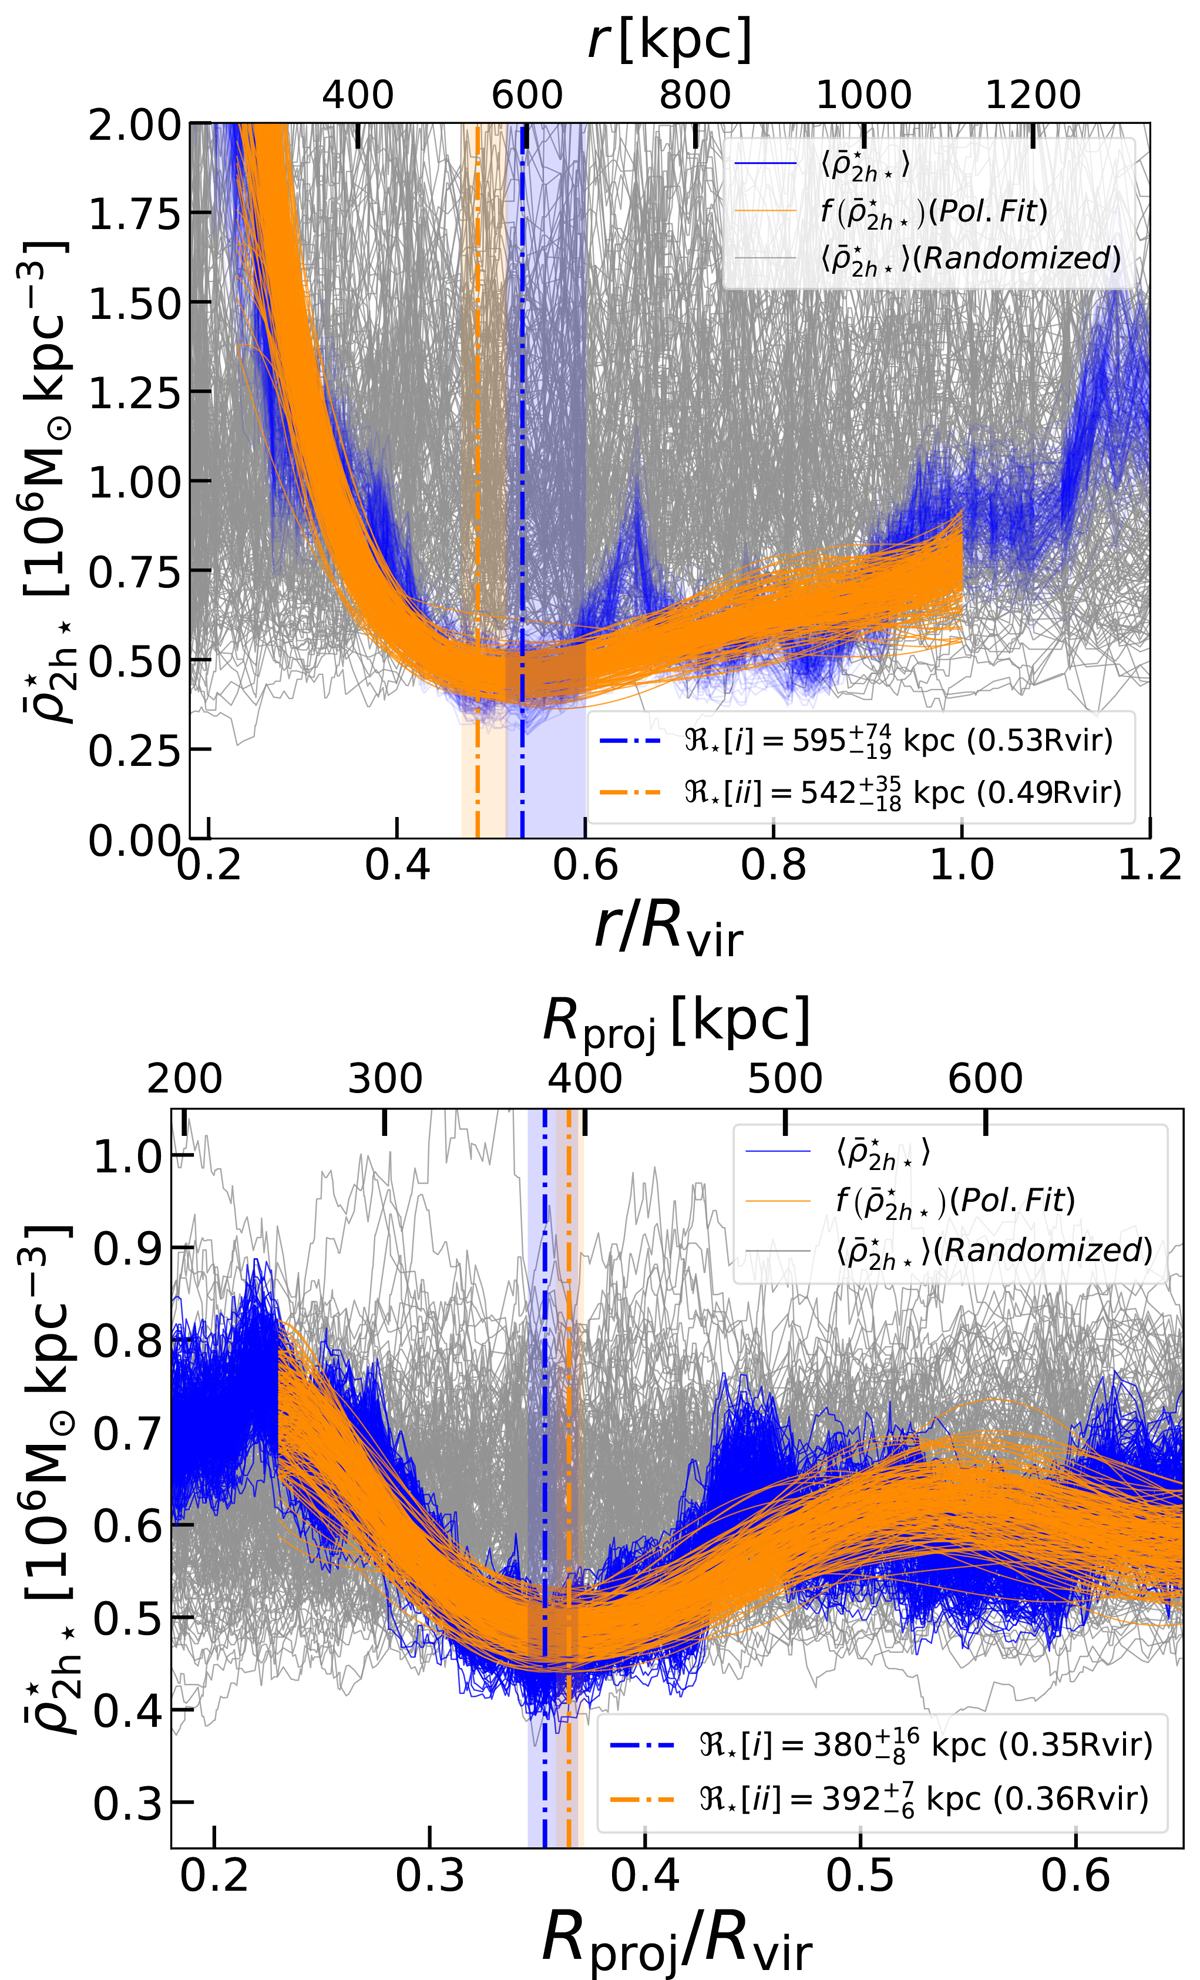
Measurement examples of the transition radius ℜ⋆: the Fornax-type cluster (top panel) from TNG50, and the Fornax cluster (bottom panel). From a total of 106 sub-sample realisations and the 106 moving average curves of the satellite mean stellar mass densities, we show here 200 (blue curves). Each curve is calculated with Eq. (17) with a sub-sample of ![]() satellites from a total of nsat. The neighbour number is a random number between
satellites from a total of nsat. The neighbour number is a random number between ![]() and
and ![]() . The first method of measurement (ℜ⋆[i]) uses Eq. (19) and is shown with vertical dot-dashed blue lines and their 1-sigma confidence region. The second method (ℜ⋆[ii]) uses Eq. (20) and is shown with vertical dot dash orange lines and their 1-sigma confidence region. Bootstrapping reveals a small scatter in the moving average profiles, due to the satellite-to-satellite sub-sample variations and the different number of neighbours used. Lastly, we also show the moving average after first randomising (shuffling) the mean mass densities of the satellites, which erases the signature in the satellite population (see Null-hypothesis test in Sect. 5.2).
. The first method of measurement (ℜ⋆[i]) uses Eq. (19) and is shown with vertical dot-dashed blue lines and their 1-sigma confidence region. The second method (ℜ⋆[ii]) uses Eq. (20) and is shown with vertical dot dash orange lines and their 1-sigma confidence region. Bootstrapping reveals a small scatter in the moving average profiles, due to the satellite-to-satellite sub-sample variations and the different number of neighbours used. Lastly, we also show the moving average after first randomising (shuffling) the mean mass densities of the satellites, which erases the signature in the satellite population (see Null-hypothesis test in Sect. 5.2).
Current usage metrics show cumulative count of Article Views (full-text article views including HTML views, PDF and ePub downloads, according to the available data) and Abstracts Views on Vision4Press platform.
Data correspond to usage on the plateform after 2015. The current usage metrics is available 48-96 hours after online publication and is updated daily on week days.
Initial download of the metrics may take a while.