Fig. 5.
Download original image
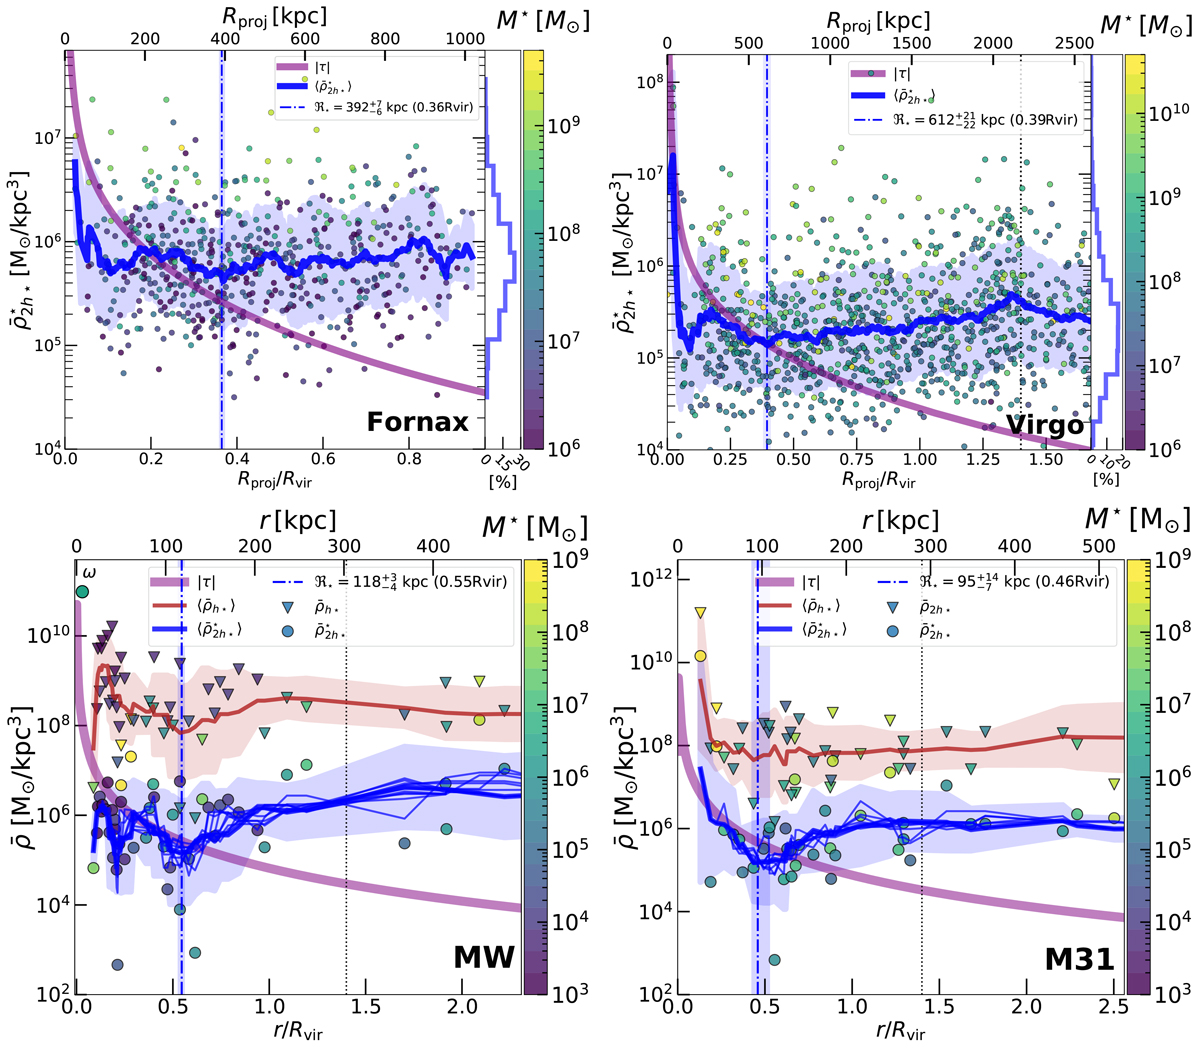
Satellite galaxy mean stellar mass densities (![]() as circles) of four observed systems: the Fornax galaxy cluster (top left panel), the Virgo cluster (top right panel), the MW (bottom left panel), and M31 (bottom right panel), with the satellite stellar masses indicated in colour. In all the panels, we show the tidal field for the host systems (|τ| in purple curves). In each panel we include the moving average profiles of the mean stellar mass densities using Eq. (17) with
as circles) of four observed systems: the Fornax galaxy cluster (top left panel), the Virgo cluster (top right panel), the MW (bottom left panel), and M31 (bottom right panel), with the satellite stellar masses indicated in colour. In all the panels, we show the tidal field for the host systems (|τ| in purple curves). In each panel we include the moving average profiles of the mean stellar mass densities using Eq. (17) with ![]() (blue curves, with the blue areas casting one standard deviation). The measured transition radii ℜ⋆ are shown for each system (dash-dotted vertical lines), and the expected location of the splashback radii ∼1.4Rvir (vertical dotted lines). For MW and M31, due to the low number of satellites, we add thinner blue curves that show moving averages
(blue curves, with the blue areas casting one standard deviation). The measured transition radii ℜ⋆ are shown for each system (dash-dotted vertical lines), and the expected location of the splashback radii ∼1.4Rvir (vertical dotted lines). For MW and M31, due to the low number of satellites, we add thinner blue curves that show moving averages ![]() where each is calculated with number of neighbours between
where each is calculated with number of neighbours between ![]() and
and ![]() . This indicates that, independent of q, all the curves show a low value of
. This indicates that, independent of q, all the curves show a low value of ![]() at ℜ⋆. In addition, for MW and M31 we show the central mean dynamical mass densities of each satellite measured within h⋆ (triangles) and the respective moving average profiles (brown curves, bottom panels). This can be compared with other studies in the literature on the
at ℜ⋆. In addition, for MW and M31 we show the central mean dynamical mass densities of each satellite measured within h⋆ (triangles) and the respective moving average profiles (brown curves, bottom panels). This can be compared with other studies in the literature on the ![]() relation for the MW satellites mentioned in Sect. 2, which show that using r instead of the pericentre also reveals an anti-correlation with distance (
relation for the MW satellites mentioned in Sect. 2, which show that using r instead of the pericentre also reveals an anti-correlation with distance (![]() ). Moreover, as predicted by the simulations, the central dynamical mass densities show a change in the moving average profile where ℜ⋆ is measured (see Fig. 2, middle panel). Histograms included in the top panels show the overall shape and peak of the distribution of
). Moreover, as predicted by the simulations, the central dynamical mass densities show a change in the moving average profile where ℜ⋆ is measured (see Fig. 2, middle panel). Histograms included in the top panels show the overall shape and peak of the distribution of ![]() for the satellites of each cluster.
for the satellites of each cluster.
Current usage metrics show cumulative count of Article Views (full-text article views including HTML views, PDF and ePub downloads, according to the available data) and Abstracts Views on Vision4Press platform.
Data correspond to usage on the plateform after 2015. The current usage metrics is available 48-96 hours after online publication and is updated daily on week days.
Initial download of the metrics may take a while.