Fig. 2.

Download original image
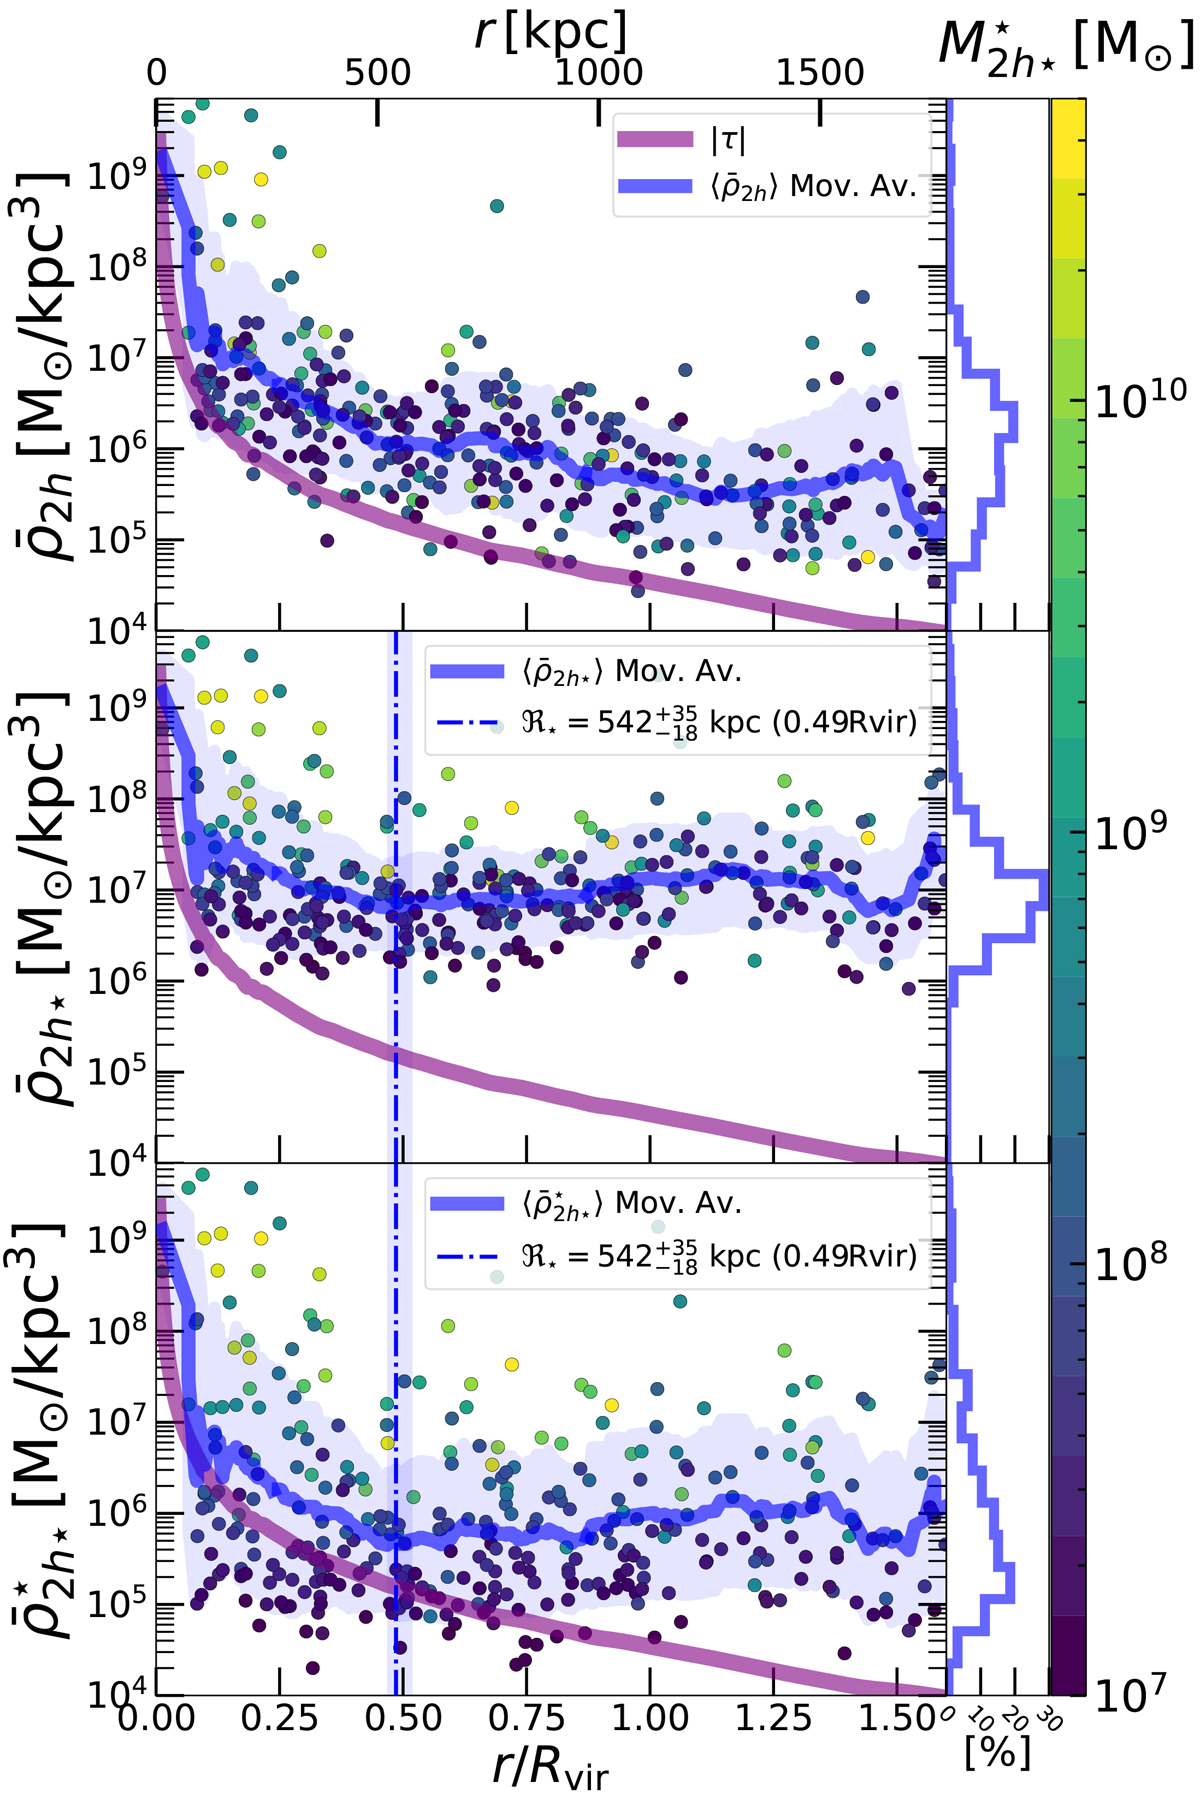
Mean mass densities of 492 satellite galaxies (circles) as a function of distance to their hosting TNG50 Fornax-type cluster, with colours indicating their stellar masses (colour bar). The cluster has a virial mass and radius of Mvir = 7.6 × 10¹³ M⊙ and Rvir = 1075 kpc, respectively, and corresponds to a snapshot at redshift z = 0. Its tidal field radial profile (|τ|) is shown in all panels (purple curve). Shown as a function of cluster-centric distance from the top to bottom panels are: the dynamical mass densities of each satellite ![]() (top), measured within 2h; the central mean dynamical mass densities
(top), measured within 2h; the central mean dynamical mass densities ![]() within 2h⋆ (middle), and the central stellar mass densities
within 2h⋆ (middle), and the central stellar mass densities ![]() within 2h⋆ (bottom). The blue curves in each plot show the moving average (Mov. Av.) of different mass densities for all the satellites using Eq. (17). The measurement of the transition radius (ℜ⋆ metric [ii]) is shown with a vertical dot-dashed line (middle and bottom panels). Histograms are shown in the right column sub-panels to show the shape of the mean mass density distributions.
within 2h⋆ (bottom). The blue curves in each plot show the moving average (Mov. Av.) of different mass densities for all the satellites using Eq. (17). The measurement of the transition radius (ℜ⋆ metric [ii]) is shown with a vertical dot-dashed line (middle and bottom panels). Histograms are shown in the right column sub-panels to show the shape of the mean mass density distributions.
Current usage metrics show cumulative count of Article Views (full-text article views including HTML views, PDF and ePub downloads, according to the available data) and Abstracts Views on Vision4Press platform.
Data correspond to usage on the plateform after 2015. The current usage metrics is available 48-96 hours after online publication and is updated daily on week days.
Initial download of the metrics may take a while.


