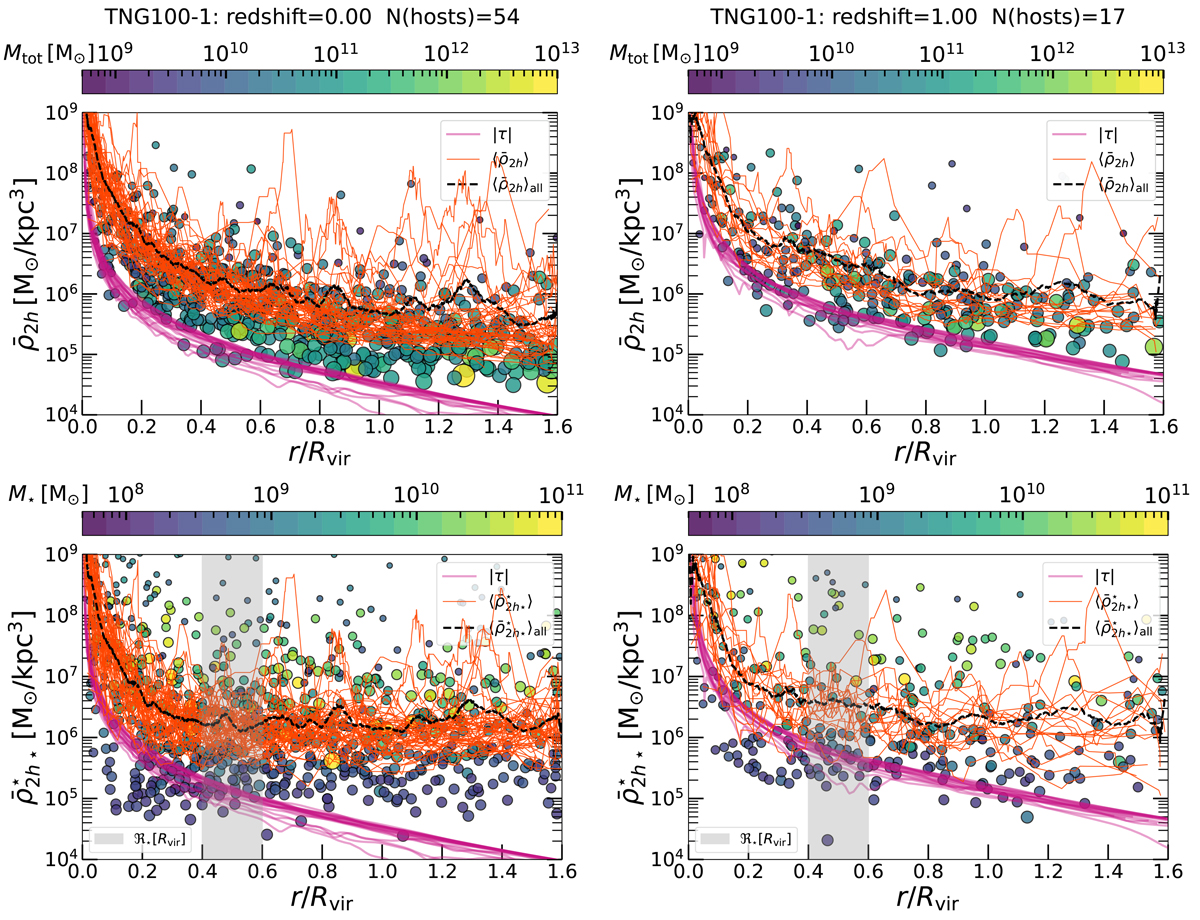
Fig. A.1.
Download original image
Mass densities of satellite galaxies vs their cluster centric distances for 54 host galaxy clusters/groups from a snapshot at redshift z = 0 (left column) and for 17 clusters/groups at z = 1 (right column), taken from TNG100 (equivalent analysis for TNG300 in Fig. 4). The tidal field profiles of all the clusters are shown in each panel (|τ| in purple curves). Top panels show the total mass mean densities of the subhaloes (circles, colour-coded by total subhalo masses), and the bottom panels show the central mean stellar mass densities (circles, colour-coded by stellar masses). To avoid overcrowding, we plotted a sub-sample with 10% (left column) and 20% (right column) of the satellites (circles). Circle sizes are proportional to h (top panels) or h⋆ (bottom panels). In each panel the moving average satellite mean mass density profile of each cluster is shown in with an orange curve. In addition, it is shown the global moving average in dashed black curve that is calculated with the moving averages of all clusters. All are moving averages are calculated with Eq. 17. The transition radii (ℜ⋆), measured in each cluster, are located within the vertical grey region (bottom panels), which are determined from the moving average of the mean stellar mass densities ![]() , marking where the
, marking where the ![]() start to increase further in. We present a similar analysis of TNG50 in Figs. A.2.
start to increase further in. We present a similar analysis of TNG50 in Figs. A.2.
Current usage metrics show cumulative count of Article Views (full-text article views including HTML views, PDF and ePub downloads, according to the available data) and Abstracts Views on Vision4Press platform.
Data correspond to usage on the plateform after 2015. The current usage metrics is available 48-96 hours after online publication and is updated daily on week days.
Initial download of the metrics may take a while.