Fig. 11.
Download original image
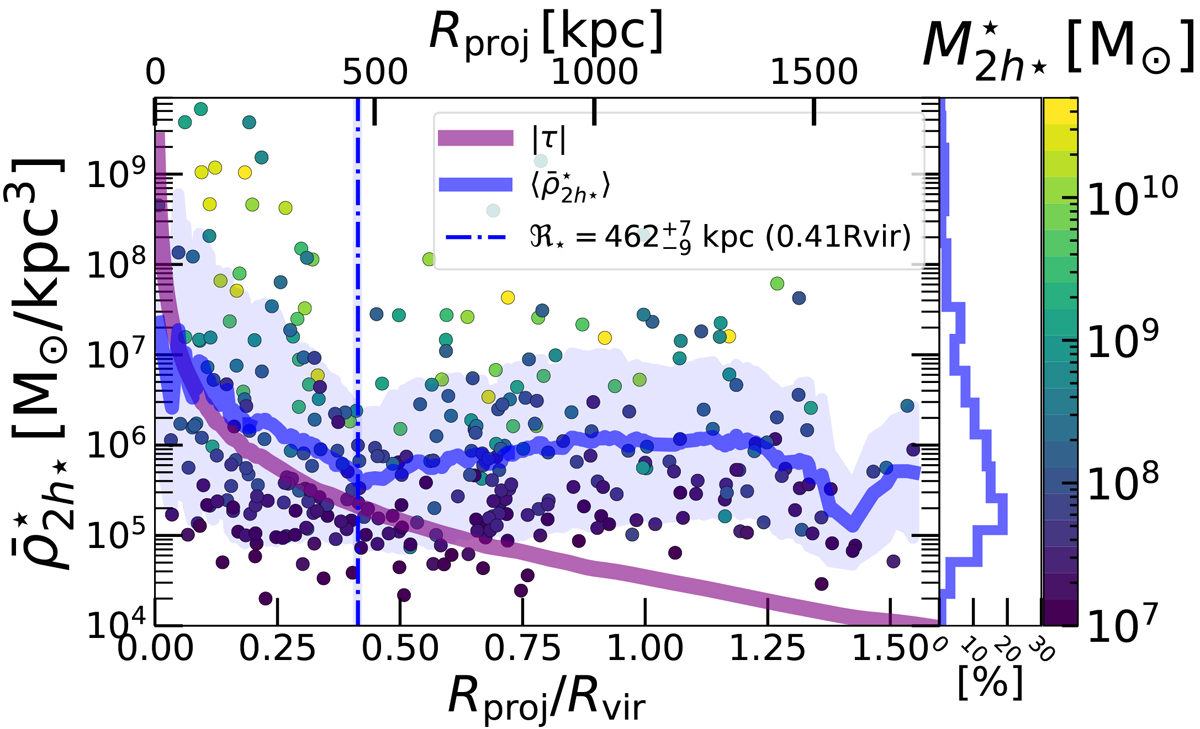
Mean stellar mass densities (![]() ) of 492 satellite galaxies (circles) as a function of their projected distances to their hosting TNG50 Fornax-type cluster, with colours indicating their stellar masses. The deprojected profile is shown in Fig. 2 (bottom panel). The host tidal field profile (|τ|) is shown with the purple curve. The blue curve shows the moving average profile using Eq. (17). The measurement of the transition radius (ℜ⋆) is performed using the projected profile Rproj (vertical dot-dash line). The histogram in the right sub-panel shows the shape of the satellite mass density distribution.
) of 492 satellite galaxies (circles) as a function of their projected distances to their hosting TNG50 Fornax-type cluster, with colours indicating their stellar masses. The deprojected profile is shown in Fig. 2 (bottom panel). The host tidal field profile (|τ|) is shown with the purple curve. The blue curve shows the moving average profile using Eq. (17). The measurement of the transition radius (ℜ⋆) is performed using the projected profile Rproj (vertical dot-dash line). The histogram in the right sub-panel shows the shape of the satellite mass density distribution.
Current usage metrics show cumulative count of Article Views (full-text article views including HTML views, PDF and ePub downloads, according to the available data) and Abstracts Views on Vision4Press platform.
Data correspond to usage on the plateform after 2015. The current usage metrics is available 48-96 hours after online publication and is updated daily on week days.
Initial download of the metrics may take a while.