Fig. 1.
Download original image
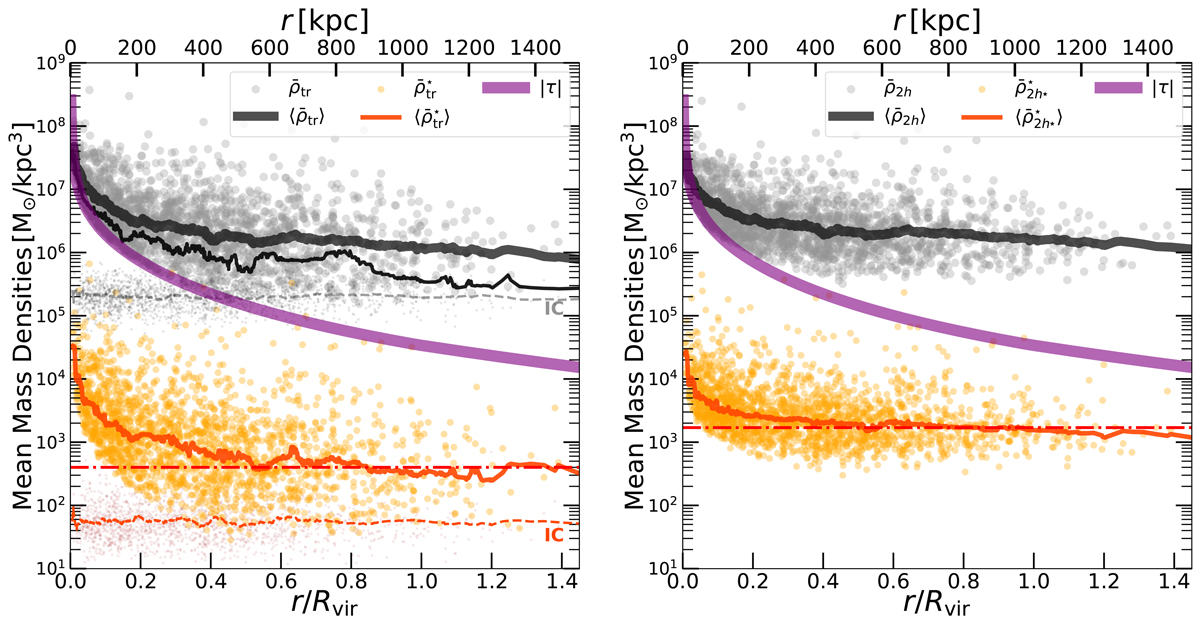
Results of the toy model showing the imprint of the host tidal field on the mean mass density distribution (circles) of nsat = 2 × 10³ satellite galaxies shown as a function their distances to the cluster centre. The host has an NFW halo mass and size of a Fornax-type cluster, showing its tidal field (|τ|) in both panels (purple curves). The satellites are taken from a snapshot after a 10 Gyr orbital integration with DELOREAN (Blaña et al. 2020). Left panel: We show the final total (i.e. dynamical) mass mean densities ![]() (large grey circles) and mean stellar mass densities
(large grey circles) and mean stellar mass densities ![]() (yellow circles) after 10 Gyr. The moving average profiles of these densities are calculated with Eq. (17) using
(yellow circles) after 10 Gyr. The moving average profiles of these densities are calculated with Eq. (17) using ![]() neighbours and are shown with solid thick black and orange curves. The IC of the total and stellar mass densities of the satellites are shown with small points in grey and brown, respectively, showing also their moving average profiles (dashed curves). In addition, we show the effect of including a population of 30% of the first in-falling satellites and the resulting moving average (thin black curve). Right panel: For the same satellites, we show the total and stellar mass mean densities measured in the central regions of each satellite within twice the half-mass radius of the total mass (2h) and the stars (2h⋆), as well as their moving averages (solid curves). The increase in the moving average profiles towards the cluster centre shows that the shrinking of the truncation radius of each satellite (rtr) produces an increasing central mean mass density as a result of the shrinking half-mass radii, h and h⋆. Moreover, the effect is more noticeable in the inner cluster regions (r < 0.5Rvir) where the tidal field is stronger and the satellites have smaller pericentres, making them more susceptible to stronger tidal stripping. The horizontal dot-dashed lines included in both panels are added for reference to illustrate the deviation of the mean stellar mass densities from constant values.
neighbours and are shown with solid thick black and orange curves. The IC of the total and stellar mass densities of the satellites are shown with small points in grey and brown, respectively, showing also their moving average profiles (dashed curves). In addition, we show the effect of including a population of 30% of the first in-falling satellites and the resulting moving average (thin black curve). Right panel: For the same satellites, we show the total and stellar mass mean densities measured in the central regions of each satellite within twice the half-mass radius of the total mass (2h) and the stars (2h⋆), as well as their moving averages (solid curves). The increase in the moving average profiles towards the cluster centre shows that the shrinking of the truncation radius of each satellite (rtr) produces an increasing central mean mass density as a result of the shrinking half-mass radii, h and h⋆. Moreover, the effect is more noticeable in the inner cluster regions (r < 0.5Rvir) where the tidal field is stronger and the satellites have smaller pericentres, making them more susceptible to stronger tidal stripping. The horizontal dot-dashed lines included in both panels are added for reference to illustrate the deviation of the mean stellar mass densities from constant values.
Current usage metrics show cumulative count of Article Views (full-text article views including HTML views, PDF and ePub downloads, according to the available data) and Abstracts Views on Vision4Press platform.
Data correspond to usage on the plateform after 2015. The current usage metrics is available 48-96 hours after online publication and is updated daily on week days.
Initial download of the metrics may take a while.