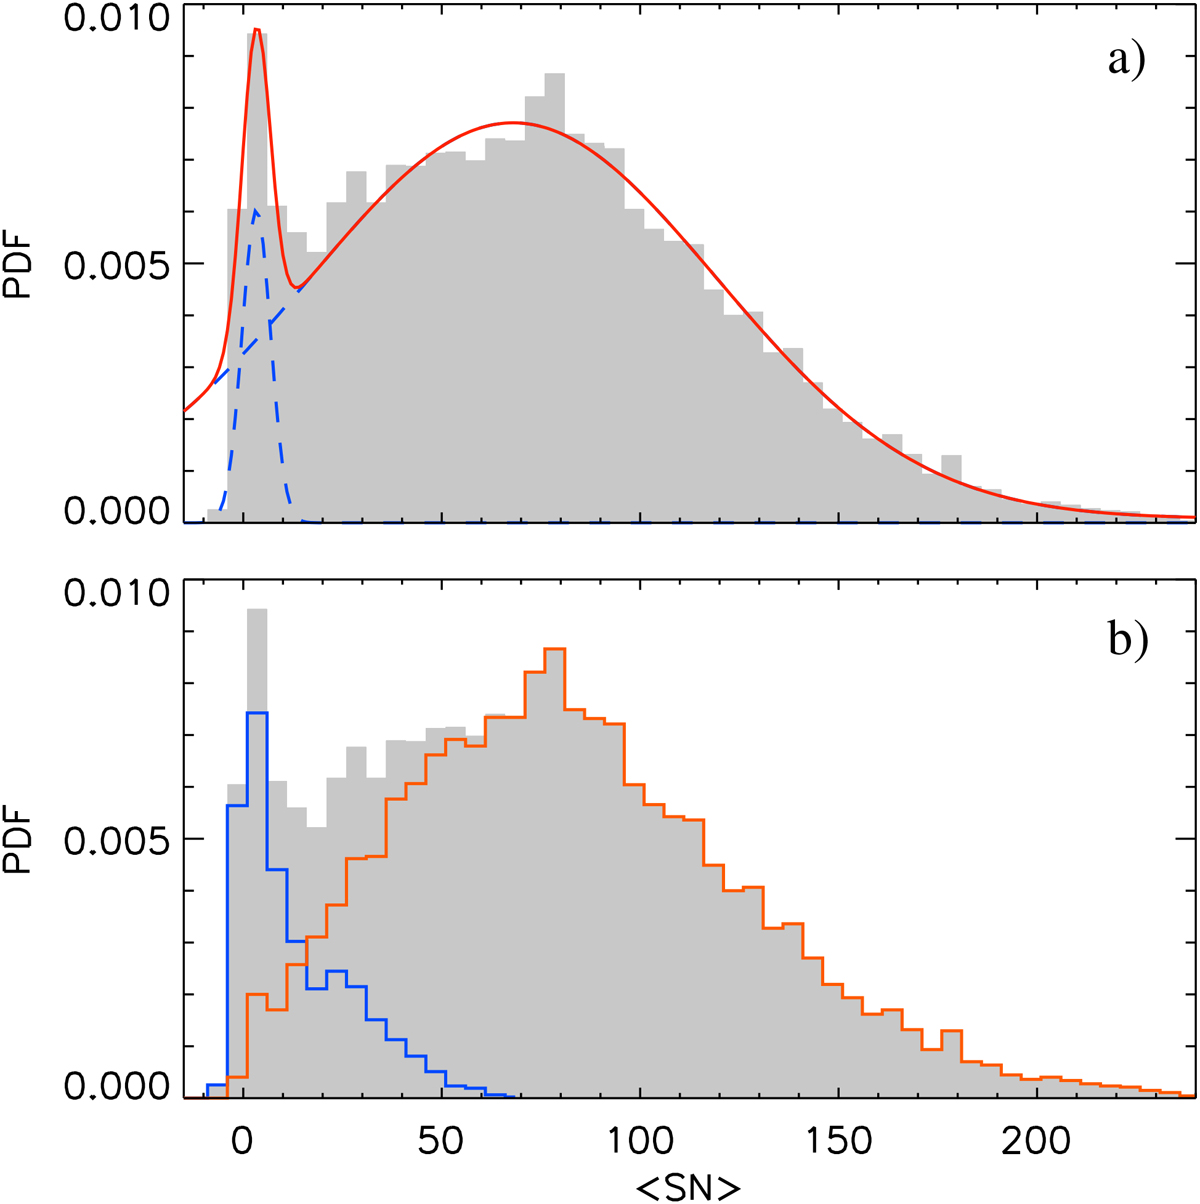
Fig. 8.
Download original image
Probability density function of the occurrence of the 11-year-average SN for 100 random realisations of the SN reconstructions (grey histogram). Panel a: Best-fit double Gaussian (μ1 = 3.3, σ1 = 3.6; μ2 = 68, σ2 = 51; red) and individual Gaussians (dashed blue). Panel b: Distributions of cycles that are defined to be part of a grand solar minimum (807–722 BC and 408–334 BC; see Table 1; blue) and the remaining cycles (orange).
Current usage metrics show cumulative count of Article Views (full-text article views including HTML views, PDF and ePub downloads, according to the available data) and Abstracts Views on Vision4Press platform.
Data correspond to usage on the plateform after 2015. The current usage metrics is available 48-96 hours after online publication and is updated daily on week days.
Initial download of the metrics may take a while.