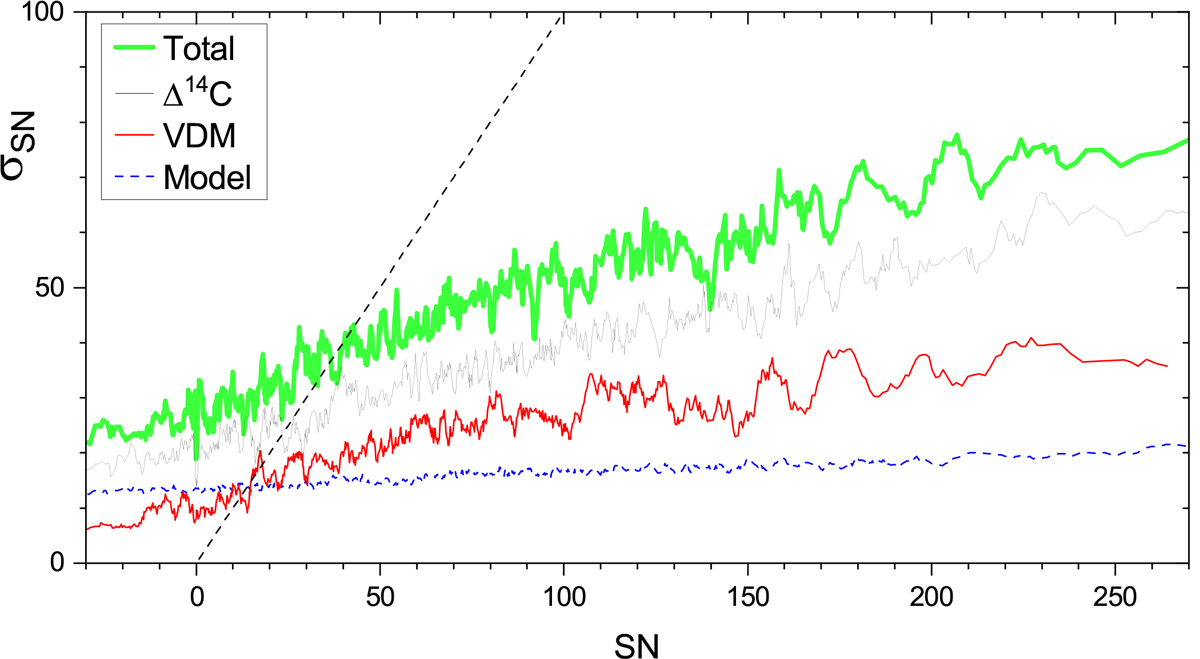
Fig. 5.
Download original image
Different types of uncertainties of the SN reconstruction as a function of the SN values estimated with the MC method. The dashed black, red, and blue curves represent the 1σ uncertainties in the SN value for the Δ14C, geomagnetic VDM, and the model uncertainties, respectively (see text). The green curve depicts the total uncertainty. The dashed black line denotes the diagonal.
Current usage metrics show cumulative count of Article Views (full-text article views including HTML views, PDF and ePub downloads, according to the available data) and Abstracts Views on Vision4Press platform.
Data correspond to usage on the plateform after 2015. The current usage metrics is available 48-96 hours after online publication and is updated daily on week days.
Initial download of the metrics may take a while.