Fig. 2
Download original image
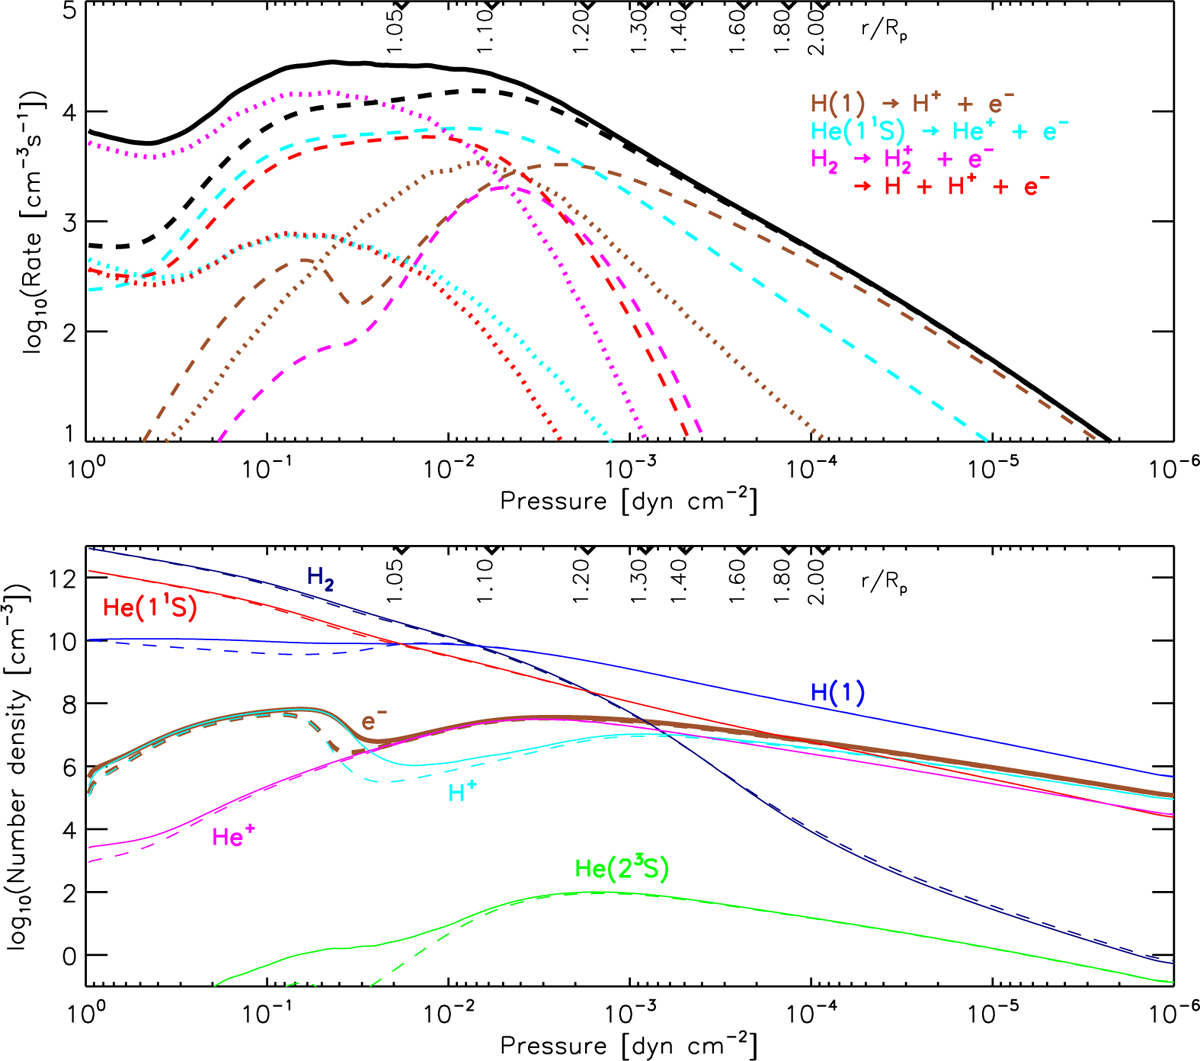
Top: production rates of primary (dashed lines) and secondary (dotted lines) electrons from the MUS-a and -b models. Colors separate the contributions by donor. The dashed black line refers to the primaries summed over all donors. The solid black line refers to the total of primaries and secondaries summed over all donors. Bottom: number densities. Dashed and solid lines refer to MUS-a and -b, respectively. Each panel provides, based on the MUS-b model, the conversion between pressure and radial distance normalized to the planet’s optical radius (r/Rp; =1 at the model’s lower boundary).
Current usage metrics show cumulative count of Article Views (full-text article views including HTML views, PDF and ePub downloads, according to the available data) and Abstracts Views on Vision4Press platform.
Data correspond to usage on the plateform after 2015. The current usage metrics is available 48-96 hours after online publication and is updated daily on week days.
Initial download of the metrics may take a while.