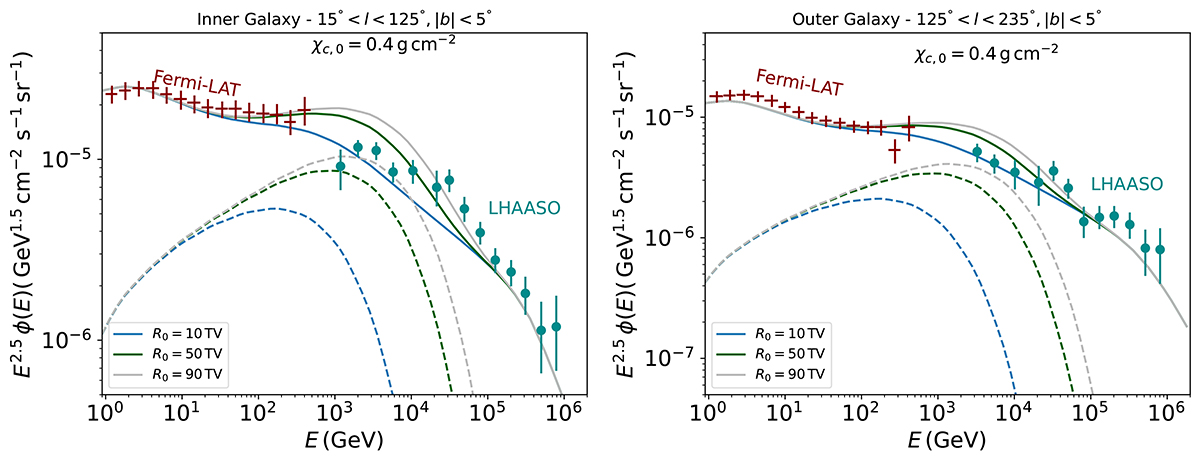
Fig. B.2.
Download original image
Left: Gamma-ray SED of the cocoons in the inner Galaxy for several cut-off values, with χc, 0 = 0.4 g cm−2 (dashed lines). The blue, green, and grey curves correspond to R0 = 10 TV, R0 = 50 TV, and R0 = 90 TV, respectively. The solid lines represent the total emission from cocoons plus the DGE under the base min set-up (De la Torre Luque et al. 2023). Right: Same as the left panel, but for the outer Galaxy. In both panels, Fermi-LAT and LHAASO data (LHAASO Collaboration 2025) are included for comparison.
Current usage metrics show cumulative count of Article Views (full-text article views including HTML views, PDF and ePub downloads, according to the available data) and Abstracts Views on Vision4Press platform.
Data correspond to usage on the plateform after 2015. The current usage metrics is available 48-96 hours after online publication and is updated daily on week days.
Initial download of the metrics may take a while.