Fig. B.1.
Download original image
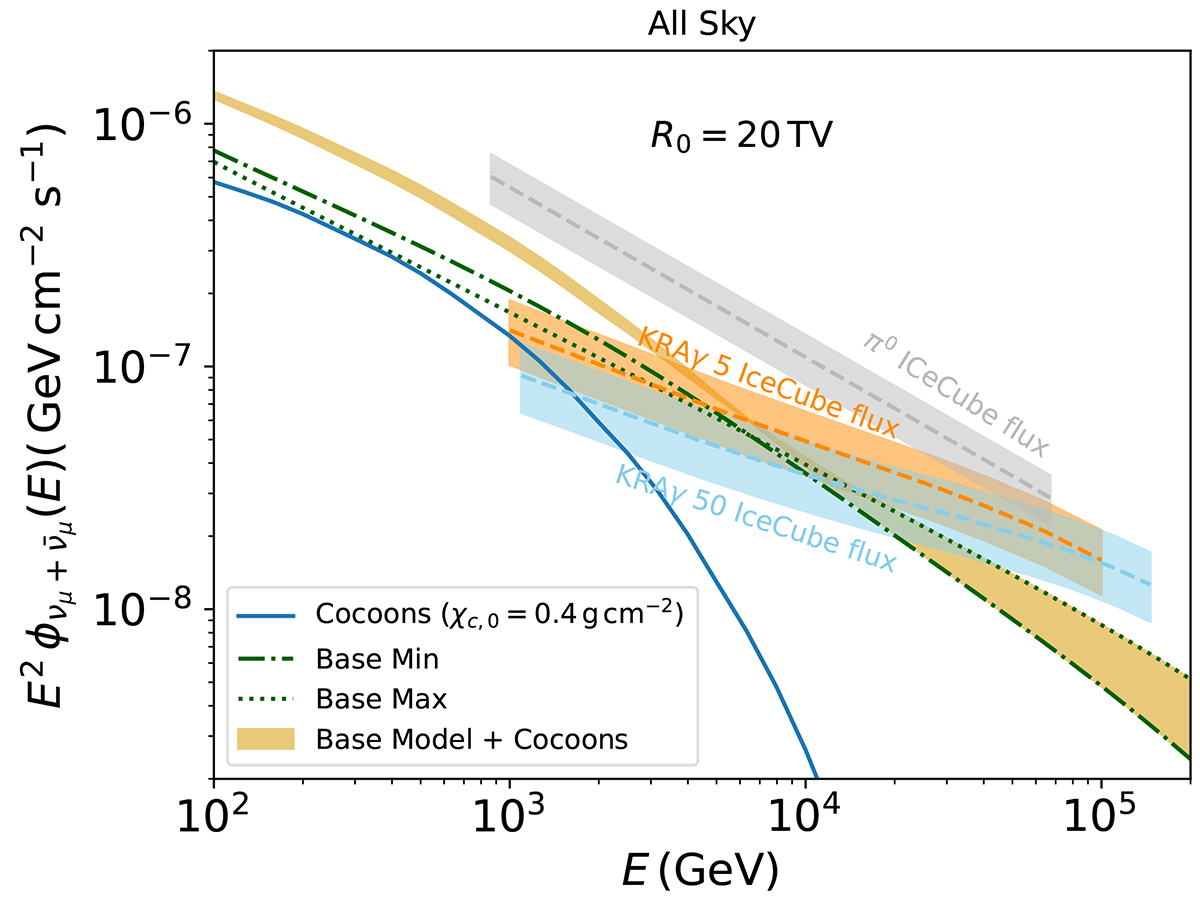
All-sky neutrino SEDs as a function of energy, comparing the total emission (DGE + cocoons, shown by the golden band) and the cocoon-only contribution (blue line). These predictions are evaluated against the IceCube flux measurements (IceCube Collaboration 2023), derived using the π0 template from Fermi-LAT Collaboration (2016) and the KRAγ 5 and 50 templates described in De la Torre Luque et al. (2023).
Current usage metrics show cumulative count of Article Views (full-text article views including HTML views, PDF and ePub downloads, according to the available data) and Abstracts Views on Vision4Press platform.
Data correspond to usage on the plateform after 2015. The current usage metrics is available 48-96 hours after online publication and is updated daily on week days.
Initial download of the metrics may take a while.