Fig. 1.
Download original image
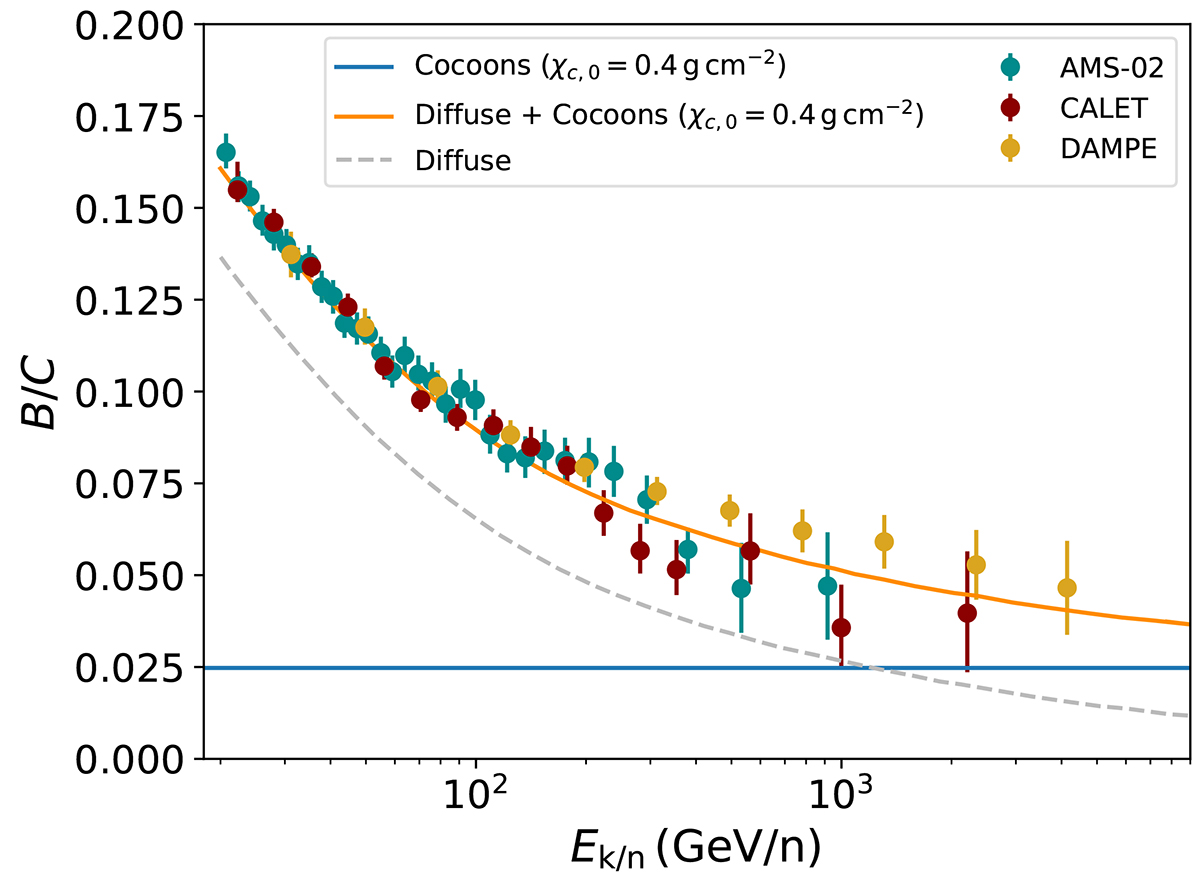
B/C as a function of the kinetic energy per nucleon. The solid orange line represents the best fit obtained by fitting AMS-02 measurements (AMS Collaboration 2018) (shown as cyan circles). The grey dashed line represents the Galactic grammage, while the solid blue line represents the cocoons contribution with χc,0 = 0.4 g cm−2. The data from CALET (in red) (CALET Collaboration 2022) and DAMPE (in gold) (DAMPE Collaboration 2022) are also shown.
Current usage metrics show cumulative count of Article Views (full-text article views including HTML views, PDF and ePub downloads, according to the available data) and Abstracts Views on Vision4Press platform.
Data correspond to usage on the plateform after 2015. The current usage metrics is available 48-96 hours after online publication and is updated daily on week days.
Initial download of the metrics may take a while.