Open Access
Fig. 3.
Download original image
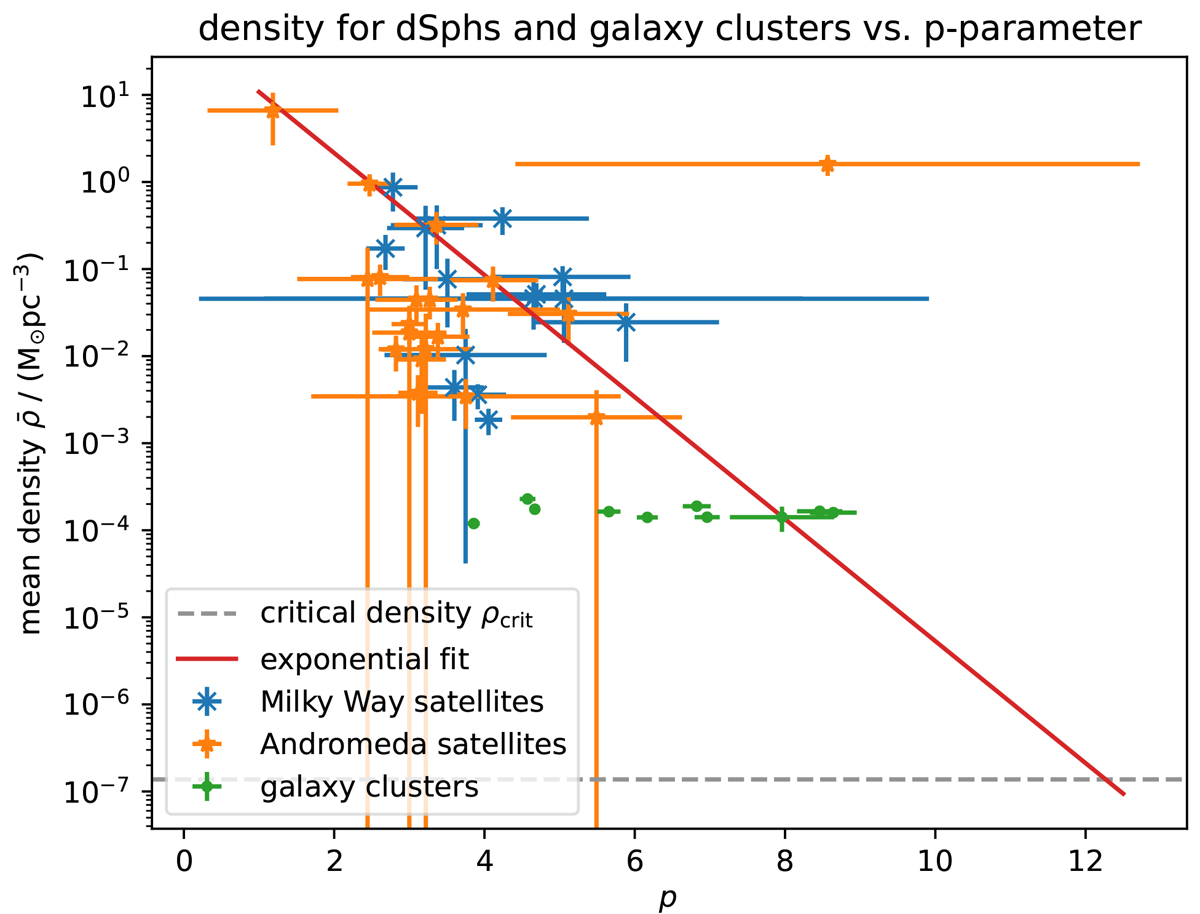
Relation between density of dSphs (blue and orange) and galaxy clusters (green) and p parameter from GPE, Eq. (1). Uncertainties are 1σ. p was obtained from the RAR, as is shown in Fig. 2. See Tables A.1 and B.1 for values. The red line is an exponential function fit to the data with χ2/ndf = 8.001.
Current usage metrics show cumulative count of Article Views (full-text article views including HTML views, PDF and ePub downloads, according to the available data) and Abstracts Views on Vision4Press platform.
Data correspond to usage on the plateform after 2015. The current usage metrics is available 48-96 hours after online publication and is updated daily on week days.
Initial download of the metrics may take a while.