Fig. A.1
Download original image
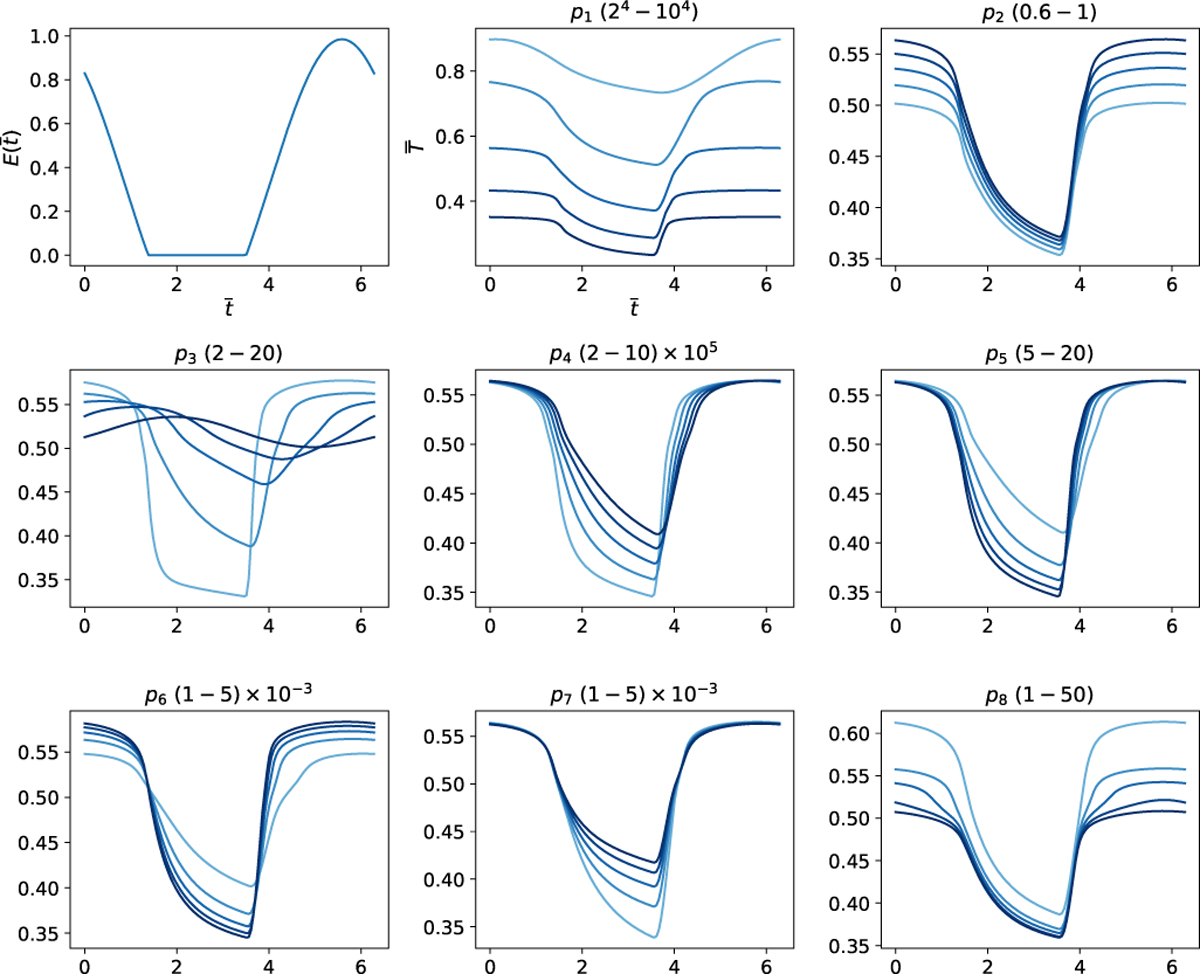
Comparative analysis of parameter sensitivity. The first panel depicts the selected example radiation flux, followed by eight panels illustrating different temperature curves under varying values of the eight distinct parameters. The titles of these panels show the variation ranges with units as the same as Table A.1 and the curves with darker hues correspond to larger values of parameters.
Current usage metrics show cumulative count of Article Views (full-text article views including HTML views, PDF and ePub downloads, according to the available data) and Abstracts Views on Vision4Press platform.
Data correspond to usage on the plateform after 2015. The current usage metrics is available 48-96 hours after online publication and is updated daily on week days.
Initial download of the metrics may take a while.