Fig. 8
Download original image
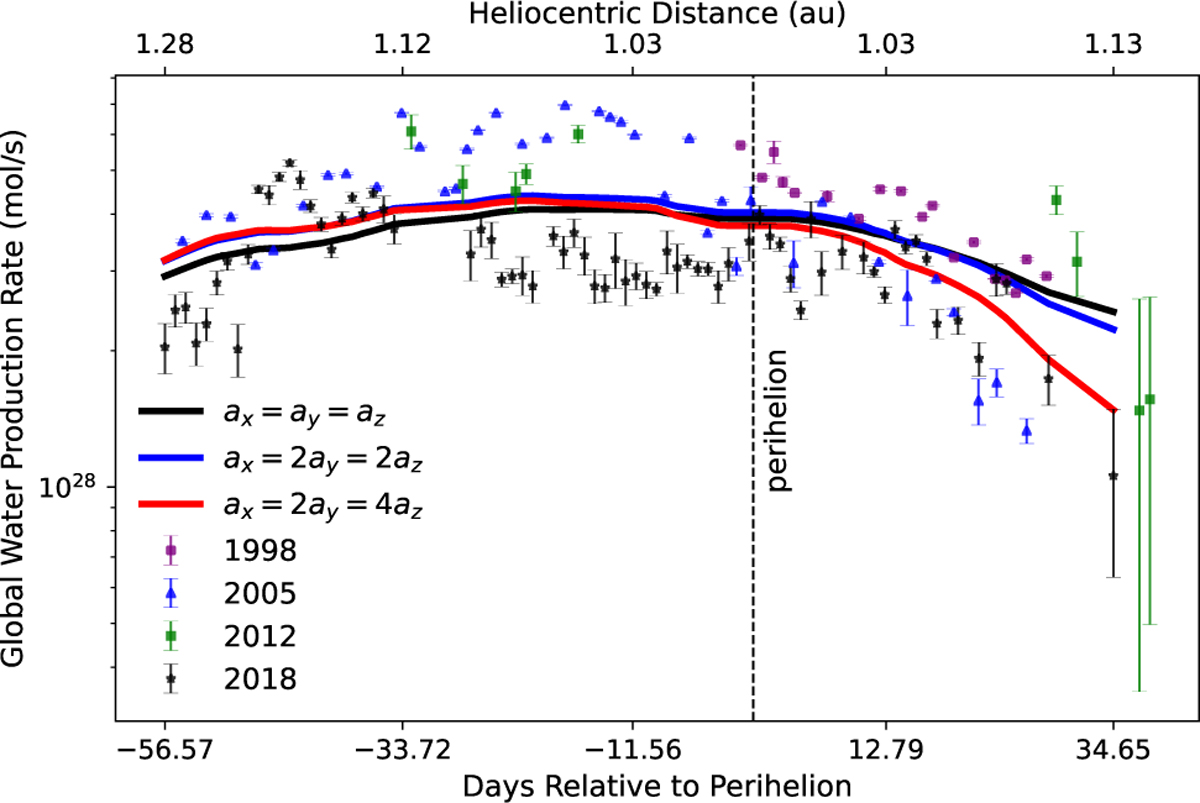
Fitting the global water production rate of 21P as a function of days from perihelion by applying ThermoONet to different shapes. The black line corresponds to a sphere model, the blue line is a ellipsoid model with ax = 2ay = 2az and the red line is a ellipsoid with ax = 2ay = 4az. Other parameters are as stated in Table 3. The scatter points with different colors and shapes represent observational data at different apparitions (Combi et al. 2019), where purple circles from 1998, blue triangles from 2005, green squares from 2012, and black asterisks from 2018. The detailed description about the observation data and sources thereof can be found in Combi et al. (2019).
Current usage metrics show cumulative count of Article Views (full-text article views including HTML views, PDF and ePub downloads, according to the available data) and Abstracts Views on Vision4Press platform.
Data correspond to usage on the plateform after 2015. The current usage metrics is available 48-96 hours after online publication and is updated daily on week days.
Initial download of the metrics may take a while.