Fig. 7
Download original image
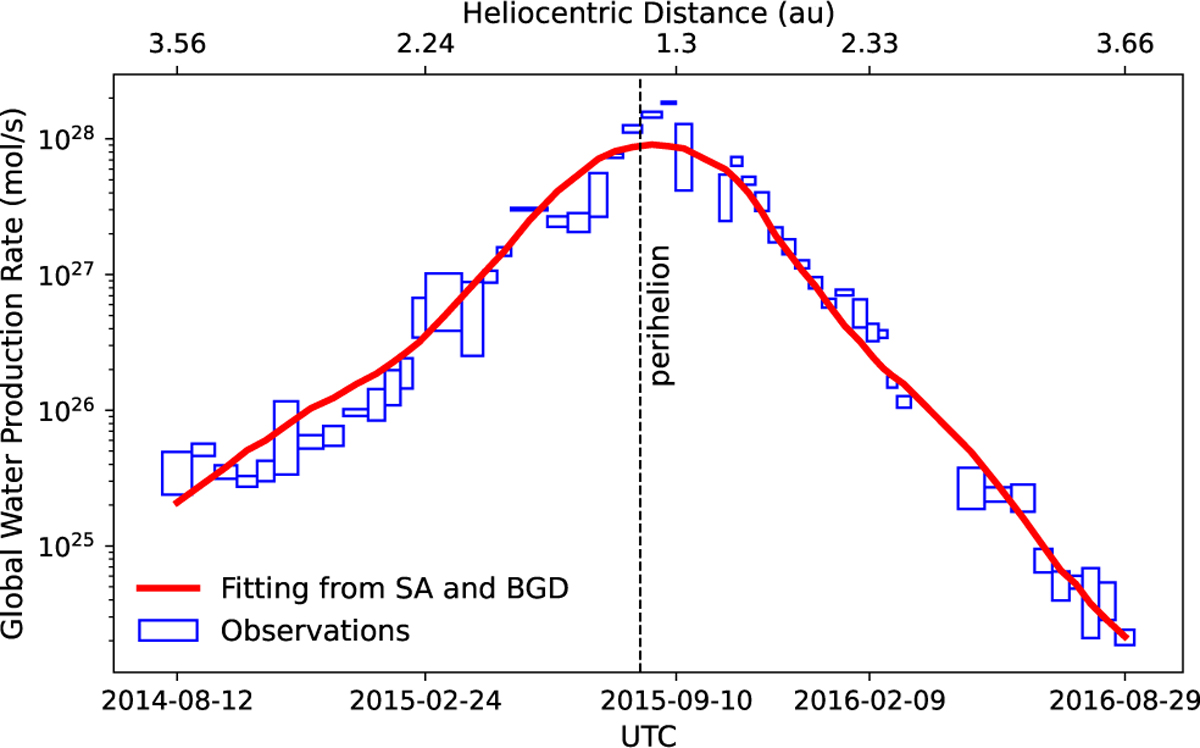
Fitting the global water production rate of 67P as a function of time. The blue rectangles represent the observation data from Läuter et al. (2020), and the red line corresponds to the best fit curve achieved by combining ThermoONet with the optimization algorithm. The black dashed line indicates the epoch of the perihelion. A detailed description of the observation data and sources thereof can be found in Läuter et al. (2020).
Current usage metrics show cumulative count of Article Views (full-text article views including HTML views, PDF and ePub downloads, according to the available data) and Abstracts Views on Vision4Press platform.
Data correspond to usage on the plateform after 2015. The current usage metrics is available 48-96 hours after online publication and is updated daily on week days.
Initial download of the metrics may take a while.