Fig. 5
Download original image
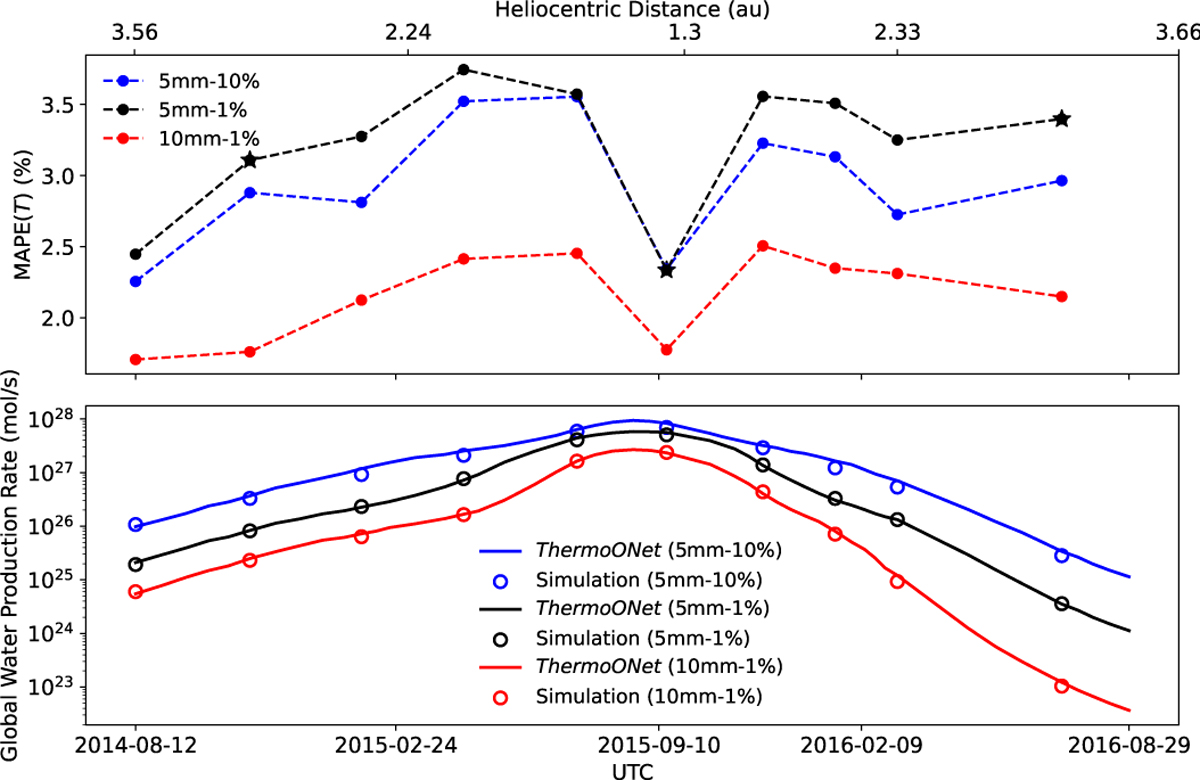
Differences in global water production rate derived from Ther-moONet and the numerical simulation at different orbital phases of comet 67P. The top panel is the temperature calculation errors, where the black line was derived with X = 5 mm, f = 1%, and the red line with X = 10 mm, f = 1%, the blue line with X = 5 mm, and f = 10%. The asterisks denote specific examples of temperature distributions shown in Fig. 6. The bottom panel is the water production rate, where the real lines stand for the results from ThermoONet, while the circles refer to the numerical solutions, with the same parameters as in the top one.
Current usage metrics show cumulative count of Article Views (full-text article views including HTML views, PDF and ePub downloads, according to the available data) and Abstracts Views on Vision4Press platform.
Data correspond to usage on the plateform after 2015. The current usage metrics is available 48-96 hours after online publication and is updated daily on week days.
Initial download of the metrics may take a while.