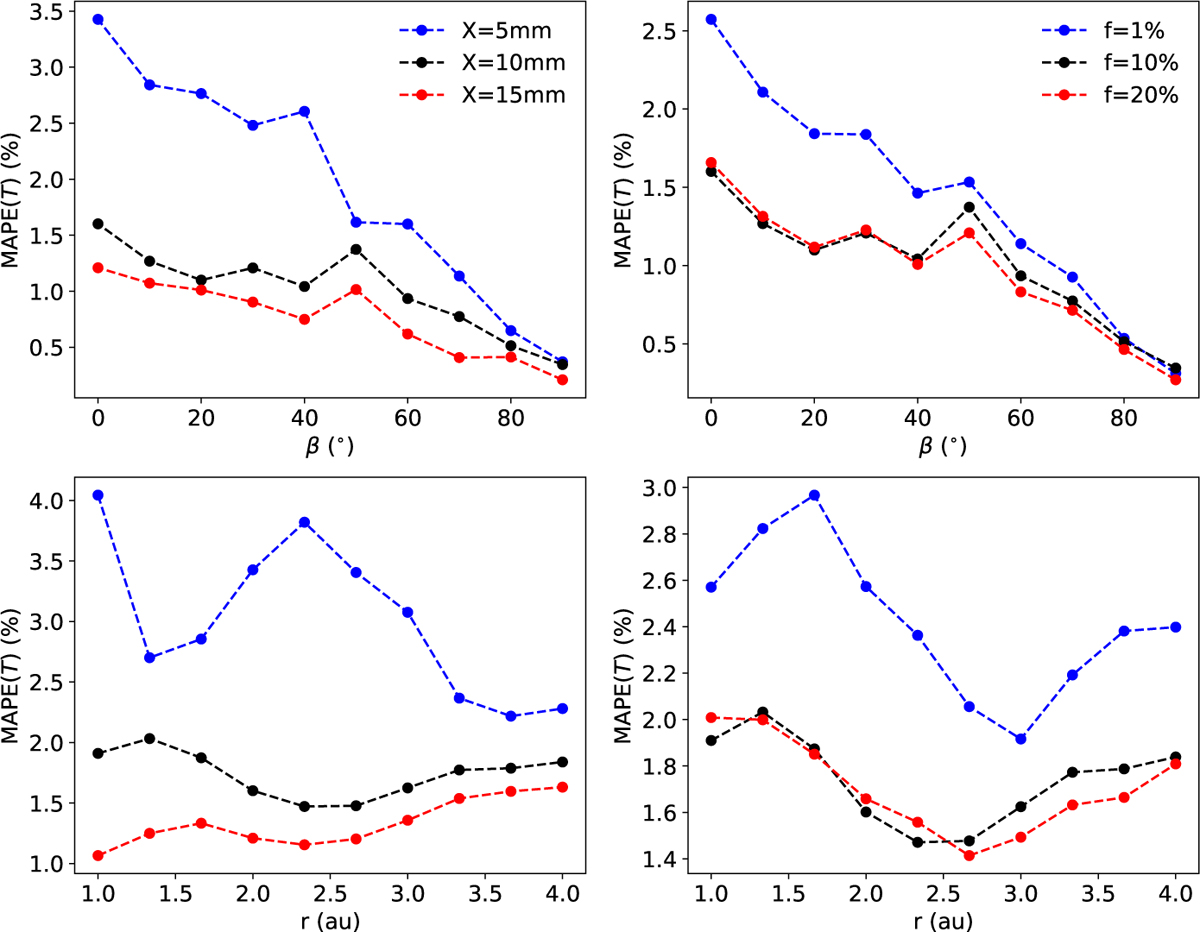
Fig. 4
Download original image
Differences in the output subsurface temperature between ThermoONet and numerical simulation as functions of obliquity, β, and heliocentric distance, r. The left panels present the error functions for different thicknesses of dust mantle, with the blue, black, and red lines, representing 5 mm, 10 mm, and 15 mm respectively. The right panels illustrate the error functions for varying icy area fractions, with the blue, black, and red lines respectively corresponding to 1%, 10%, and 20%. The panels are fixed to r = 2 au for the top and β = 0° for the bottom, along with f = 10% for the left panels and X = 10 mm for the right panels. For the settings of other parameters, we refer to Table 1.
Current usage metrics show cumulative count of Article Views (full-text article views including HTML views, PDF and ePub downloads, according to the available data) and Abstracts Views on Vision4Press platform.
Data correspond to usage on the plateform after 2015. The current usage metrics is available 48-96 hours after online publication and is updated daily on week days.
Initial download of the metrics may take a while.